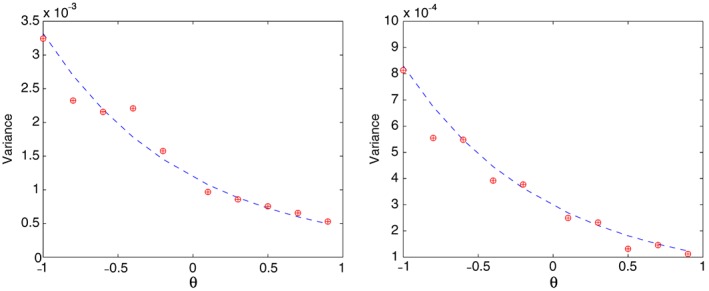
Figure 2.

The estimated variance of the one‐step (plus signs) and non‐linear least squares (circles) estimators and , respectively, based on 500 simulations with n=101 and ϵj∼N(0,0.052),j=1…,n. The estimates are superimposed on the theoretical asymptotic variance (dashed line). The left plot is for ξ0=0.5, and the right one is for ξ0=1.
