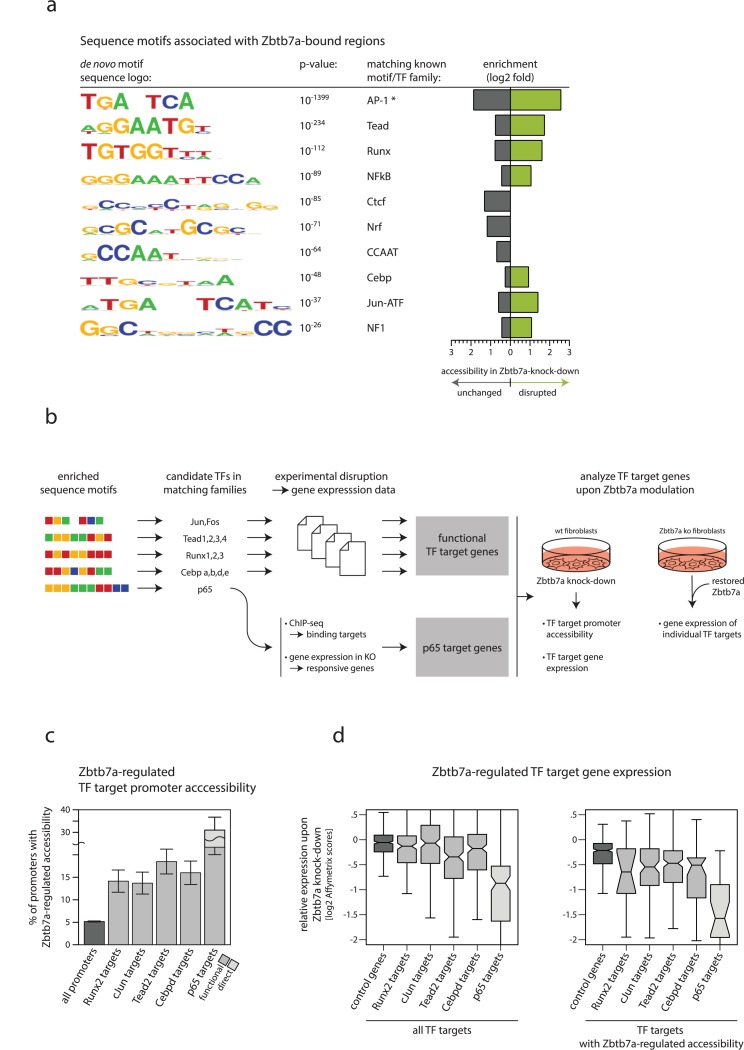
Fig 4. Target genes of a diverse set of TFs exhibit Zbtb7a-dependent promoter accessibility and expression.
(A) DNA sequence motifs that are consistently enriched at Zbtb7a ChIP-seq peaks (note that the binding motif for Zbtb7a itself is also highly enriched, but not shown here). Known TF families with specificities matching each motif are indicated. Grey and green bars display the log2 fold-enrichment of each motif among the subset of peaks exhibiting unchanged (grey) or disrupted (green) DNase-I hypersensitivity levels in Zbtb7a-knockdown fibroblasts. *Note that the motif TGANTCA belongs to a previously identified set of motifs that are commonly found to be enriched within unrelated genome-wide datasets [24], suggesting caution in interpretation based on motif enrichment alone, in this instance. (B) Schematic illustration of the strategy for identifying candidate Zbtb7a-utilising TF target genes and for experimentally analysing Zbtb7a dependence of promoter accessibility and gene expression. (C) Percentages of all promoters, and of target promoters of selected TFs, that exhibit Zbtb7a-regulated accessibility (experimentally defined as significantly reduced DNase-I hypersensitivity in Zbtb7a-knockdown fibroblasts, using a statistical cutoff of P < 0.05). Candidate TFs were identified using the scheme in panel b, and only targets of individual TFs that exhibit enrichment for Zbtb7a-regulated accessibility are shown. Error bars indicate 95% CIs. Significance of enrichments: Runx2 q = 1.4 × 10⁻⁶; cJun P = 1.4 × 10⁻⁶; Tead2 q = 2.3 × 10⁻¹¹; Cebpd q = 1.7 × 10⁻⁸; p65 P = 1.9 × 10⁻²⁹. (D) Microarray-based analysis of changes in mRNA expression levels upon Zbtb7a knockdown in fibroblasts, among target genes of selected TFs. Left: all TF target genes; right: target genes that also exhibit Zbtb7a-regulated accessibility. Lines in boxplots indicate median values; whiskers extend to the most extreme data within 1.5× the IQR from the box; outliers are not shown. Significance of expression differences: Runx2 P = 8.9 × 10⁻³; cJun P = 2.3 × 10⁻⁷; Tead2 P = 9.7 × 10⁻¹¹; Cebpd P = 4.9 × 10⁻⁶; p65 P = 1.8 × 10⁻¹⁴. Additional details of statistical analysis are provided as Supporting information, and numerical values underlying figures are reported in S1 Data. ChIP-seq, chromatin immunoprecipitation sequencing; IQR, interquartile range; TF, transcription factor.

