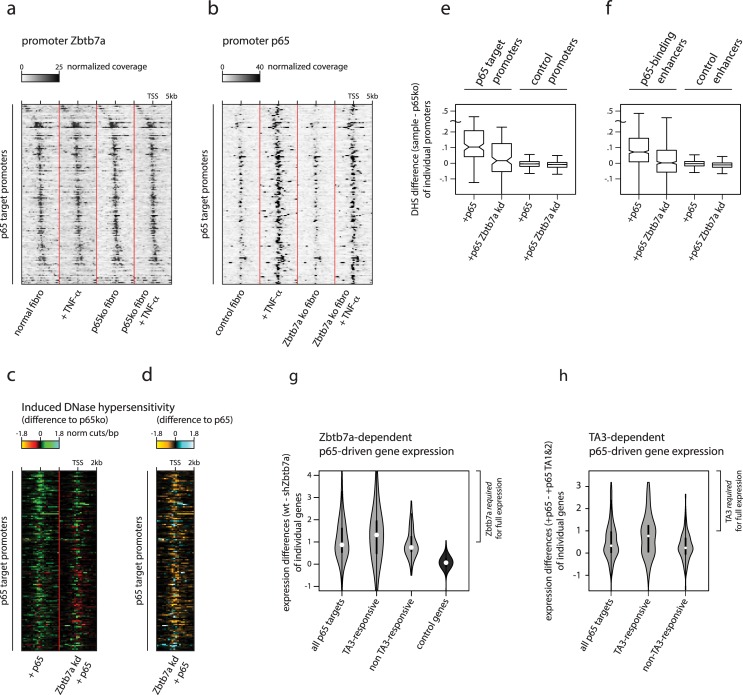
Fig 6. Prebinding of Zbtb7a can specify the responsiveness of promoters and enhancers to induction of accessibility by TFs.
(A) Zbtb7a ChIP signals at p65 target promoters in untreated (left) and TNF-α-treated (left centre) normal fibroblasts, and untreated (right centre) and TNF-α-treated (right) p65-knockout fibroblasts. Promoters are sorted in order of Zbtb7a peak position. (B) p65 ChIP signals at p65 target promoters in untreated (left) and TNF-α-treated (left centre) control (congenic p53-knockout) fibroblasts, and untreated (right centre) and TNF-α-treated (right) fibroblasts derived from Zbtb7a-knockout fibroblasts. Promoters are sorted in order of Zbtb7a peak position. (C, D) Induced DNase-I hypersensitivity at p65 target promoters, in TNF-α-treated control or Zbtb7a-knockdown fibroblasts expressing p65. DNase hypersensitivity levels are shown at individual promoters as the differences to the levels observed in non-reconstituted p65-knockout fibroblasts (C), or as the differences between Zbtb7a-knockdown and control fibroblasts (D). (E, F) DNase-I hypersensitivity levels induced by p65, at p65 target and control promoters (E) or enhancers (F), in TNF-α-treated control and Zbtb7a-knockdown fibroblasts. Induced levels represent differences in mean cut frequencies within ±600 bp surrounding the TSS for promoters, or surrounding enhancer midpoints, compared to p65-knockout fibroblasts. Lines in boxplots indicate median values; whiskers extend to the most extreme data within 1.5× the IQR from the box; outliers are not shown. Significance of difference to Zbtb7a knockdown: p65 target promoters P = 2.4 × 10⁻⁸; p65-binding enhancers P = 1.1 × 10−134. (G) mRNA expression differences between TNF-α-treated control and Zbtb7a-knockdown fibroblasts expressing p65, at distinct gene sets. Genes whose expression levels are most reduced by Zbtb7a knockdown are indicated as those for which Zbtb7a is required for full expression. Dots in violins indicate mean values. Significance of expression difference between TA3-responsive and control genes: P = 1.6 × 10⁻²⁶. (H) mRNA expression differences between TNF-α-treated fibroblasts expressing p65 and those expressing the p65 TA1&2 variant, at distinct gene sets. Genes whose expression levels are most reduced in p65 TA1&2-expressing cells (lacking the TA3 region) are indicated as those for which TA3 is required for full expression. Dots in violins indicate mean values. Significance of expression difference between TA3-responsive and control genes: P = 2.3 × 10⁻¹². Additional details of statistical analysis are provided as Supporting information, and numerical values underlying figures are reported in S1 Data. ChIP, chromatin immunoprecipitation; IQR, interquartile range; TF, transcription factor; TNF-α, tumour necrosis factor alpha; TSS, transcription start site.

