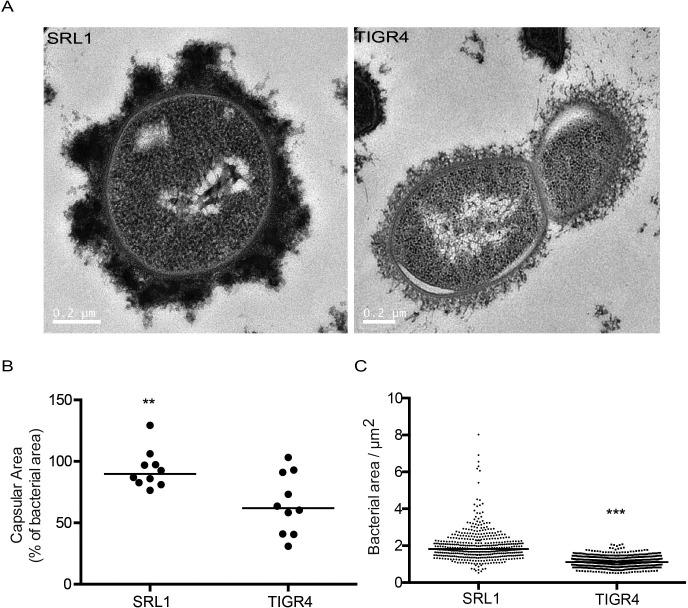
Fig 1. Capsular size of bacterial isolates.
Bacteria were visualized using electron microscopy and fluorescence microscopy with dextran exclusion. (A) Representative transmission electron microscopy images of SRL1 and TIGR4 following fixation using ruthenium red and lysine-acetate. (B) Capsular area of SRL1 and TIGR4 as visualized by electron microscopy. (C). Area of dextran exclusion per bacterial cell. (B-C) Line shows median. (Significant difference by Mann Whitney test, ** p < 0.01, ***, p < 0.001).

