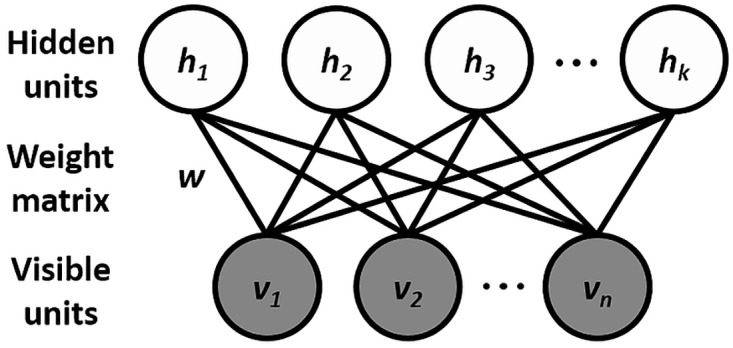
Fig 8. Graphical model associated to the RBM.

The visible variables are represented by v (in our case, the ratios between the EEG frequency bands and the EMG), h are the latent variables, and w are the weights on the undirected connections between visible and hidden units. EEG, electroencephalography; EMG, electromyography; RBM, restricted Boltzmann machine.
