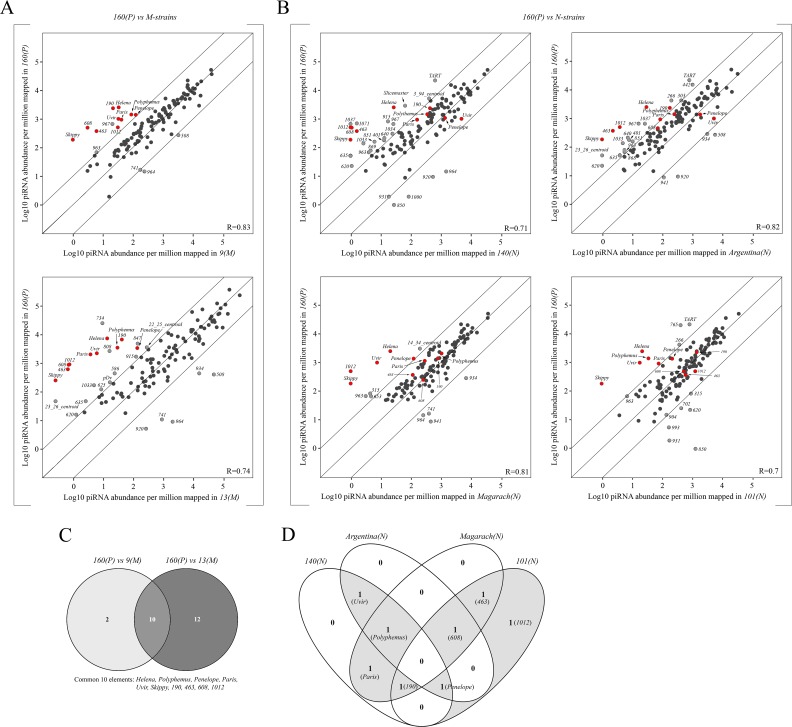
Fig 2. Comparative analysis of the ovarian piRNA profiles between P-like strain 160 and both M- and neutral (N) strains studied.
A) and B) Scatter plots represent the result of pairwise comparison of normalized piRNAs (23–29 nt) in P-strain 160 versus M-like strains 9 and 13, and in P-strain 160 versus N-strains 140, Argentina, Magarach and 101, respectively. Diagonal lines indicate 10-fold levels of difference. All the TEs that exceed 10-fold line are marked as gray dots. The red dots indicate TEs that are shared between M-strains 9 and 13 in terms of their low expression levels in comparison with P-strain 160. Spearman’s correlation (R) is shown. C) Venn diagram depicting differences and similarities in a number of TEs exhibiting 10-fold lower piRNA expression level in M-strains 9 and 13 in comparison with P-strain 160. 10 families show the same pattern of deficit in strains 9 and 13, relative to strain 160. D) Venn diagram demonstrates distribution of piRNAs to eight essential elements distinguishing neutral strains from M-like in terms of piRNA-mediated silencing among studied N-strains.

