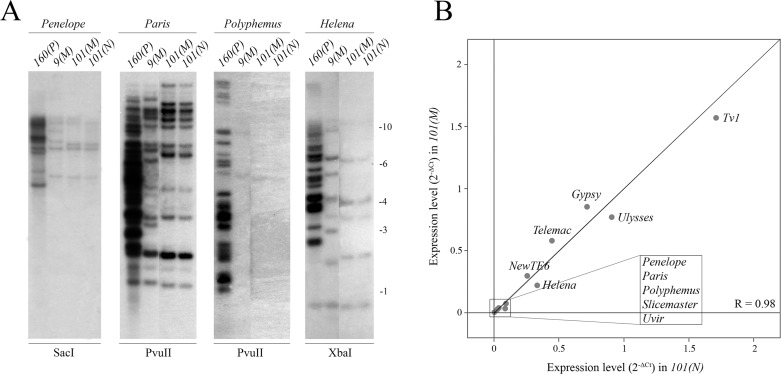
Fig 6. Genomic abundance and expression levels of putative HD-implicated TEs (Penelope, Paris, Polyphemus and Helena) in both cytotype variants of strain 101.
A) Southern blot analysis of genomic DNA of 160(P), 9(M), 101(M) and 101(N) strains. B) Expression levels of described D. virilis TEs in the ovaries of both variants of strain 101. Spearman’s rank test was used to calculate the correlation (R) between the strains studied.

