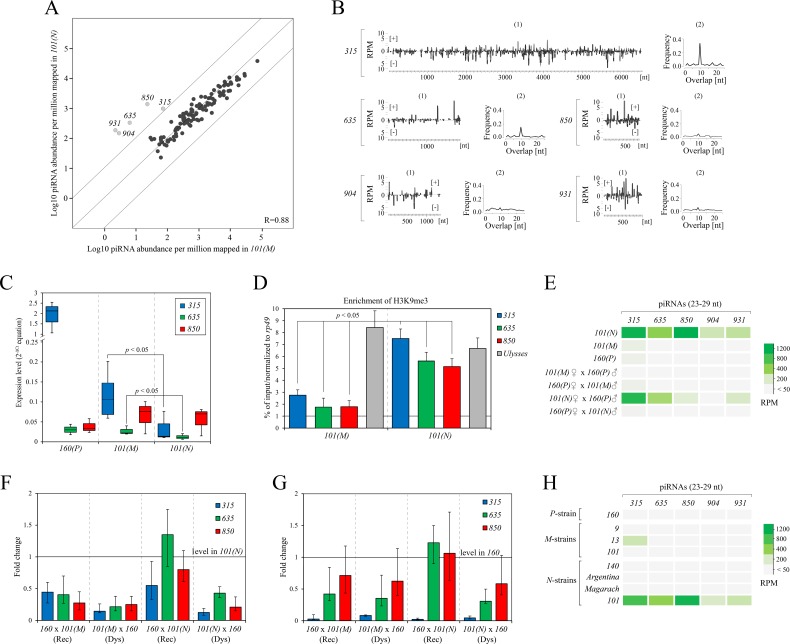
Fig 7. Characterization of small RNA mediated silencing in substrains of 101 exhibiting different cytotype.
A) Scatter plot represent the result of pairwise comparison of normalized piRNAs (23–29 nt) in M-like strain 101 versus its neutral variant. Diagonal lines indicate 10-fold levels of difference. Gray dots indicate the repeats exhibiting more than 10-fold greater piRNA level. Spearman’s rank test was used for correlation (R) calculation. B) (1) The coverage of normalized 315, 635, 850, 904 and 931-derived piRNA reads (23–29 nt) from the 101(N) strain on the entire body of correspondent elements. Sense reads are shown as [+], antisense as [–]. (2) The ping-pong signature of 315, 635, 850, 904 and 931-derived piRNAs. C) Expression levels of 315, 635, 850 elements in the ovaries of 160(P), 101(M) and 101(N) strains. P-values were calculated using t-test. D) Enrichment of H3K9me3 mark on the genomic loci carrying 315, 635 and 850 using ChIP-qPCR on ovaries of substrains 101. E) Heatmap of the ovarian expression of 315, 635, 850, 904, 931-derived piRNAs in dysgenic and reciprocal hybrids. F) Expression levels of 315, 635, 850 elements in the progeny from dysgenic and reciprocal crosses relative to parental 101(N) levels and G) to 160(P) levels. H) Heatmap represents expression pattern of 315, 635, 850, 904, 931-targeted piRNAs among the studied P-like, M-like and neutral strains.

