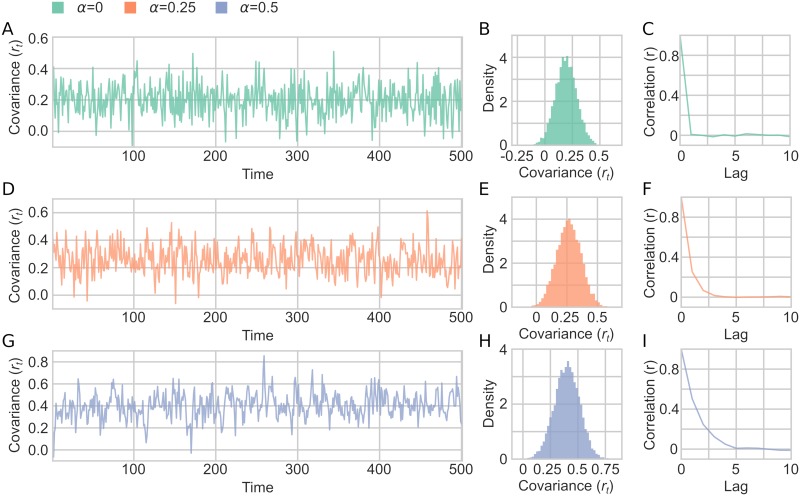
Fig 5. A sample of fluctuating covariance generated in Simulation 2.
(A-C) α = 0 and σr = 0.1. (A) An example of rt fluctuating over time, showing only first 500 time points shown for illustration purposes. (B) Distribution of the fluctuating covariance parameter (rt) (C) Autocorrelation of rt for 10 lags. (D-F) Same as A-C but with α = 0.25. (G-I) Same as A-C but with α = 0.5.

