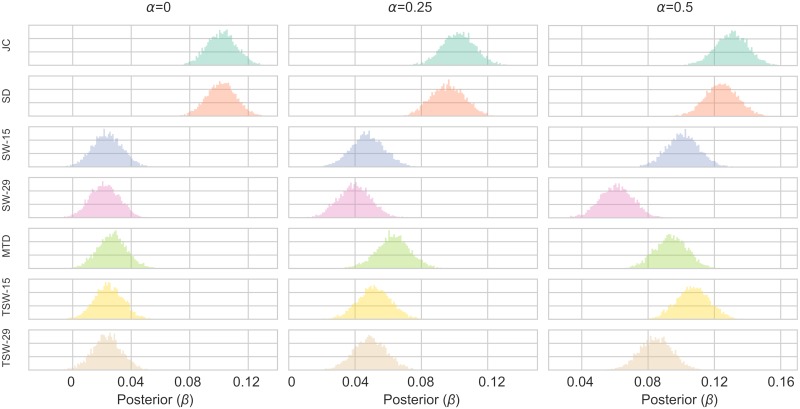
Fig 6. Posterior distributions of the β parameter of the Bayesian linear regression models in Simulation 2.
The figure shows the results for varying values of the autocorrelation parameter (α) where the variance of the fluctuating covariance (σr) is equal to 0.1. See S1 Appendix for other values of σr. For each parameter configuration, a model was created for each TVC method. The TVC estimate was the independent variable estimating the fluctuating covariance (rt) between the two time series.

