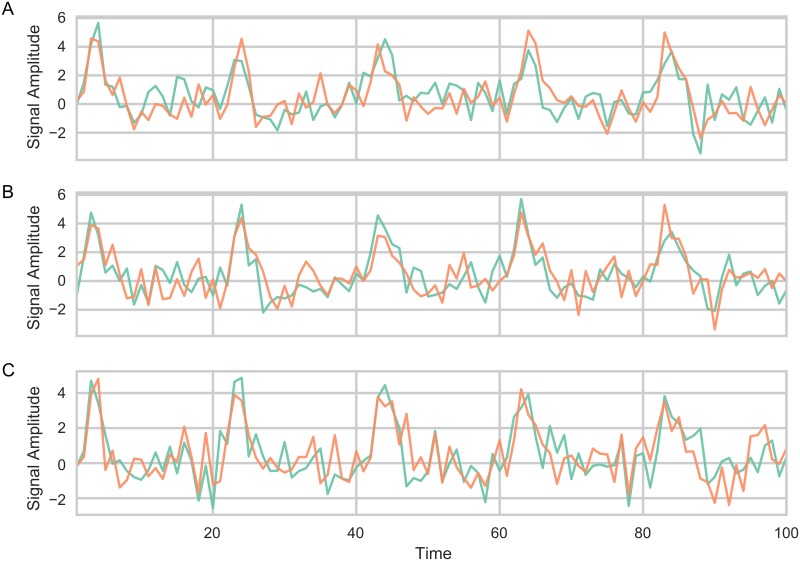
Fig 7. Examples of time series used in Simulation 3 where the mean of the time series is sampled from a time series that included a train of simulated event related HRF fMRI responses (spaced apart every 20 time points).
Only the first 100 time points are shown for illustration purposes. (A) α = 0, (B) α = 0.25, (C) α = 0.5.

