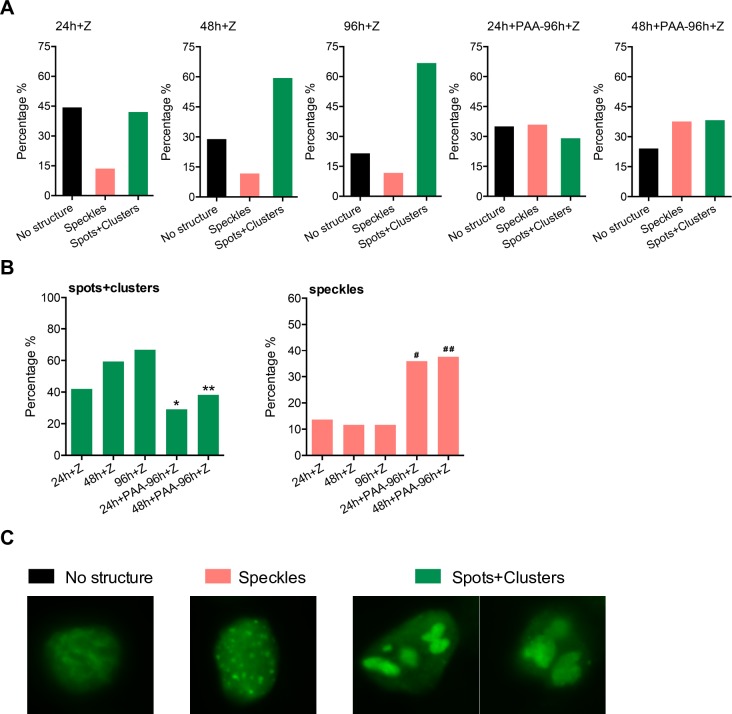
Fig 7. Kinetics and characteristics of viral replication factories after PAA treatment.
Manual cell counting was performed to quantify the morphological changes of viral replication factories induced by inhibiting viral DNA replication. 15–20 fields of each slide were randomly chosen for counting under the objective magnification of 63X. A minimum of 150 cells were counted. Cell numbers were expressed as percentage of cells permissive of lytic replication (all BMRF1 positive cells). (A) Quantification of morphological changes of viral replication foci by manual cell counting. Each BMRF1 positive cell was categorized as either having no structure, speckles or spots/clusters. Characteristics of each type of structure are shown in micrographs of representative cells in (C) below. BMRF1, the polymerase-associated processivity factor (stained green) was used as a marker for viral replication foci. (B) Statistical analysis of changes in both large foci (spots and clusters) and small foci (speckles) under indicated conditions. * significant difference from PAA-untreated samples at 24 hrs (p<0.05) and at 96 hrs (p<0.001); ** significant difference from PAA-untreated samples at 48 hrs (p<0.001) and at 96 hrs (p<0.0001); # significant difference from PAA-untreated samples at 24 hrs (p<0.0001) and at 96 hrs (p<0.001); # # significant difference from PAA-untreated samples at 48 hrs and at 96 hrs (p<0.0001).

