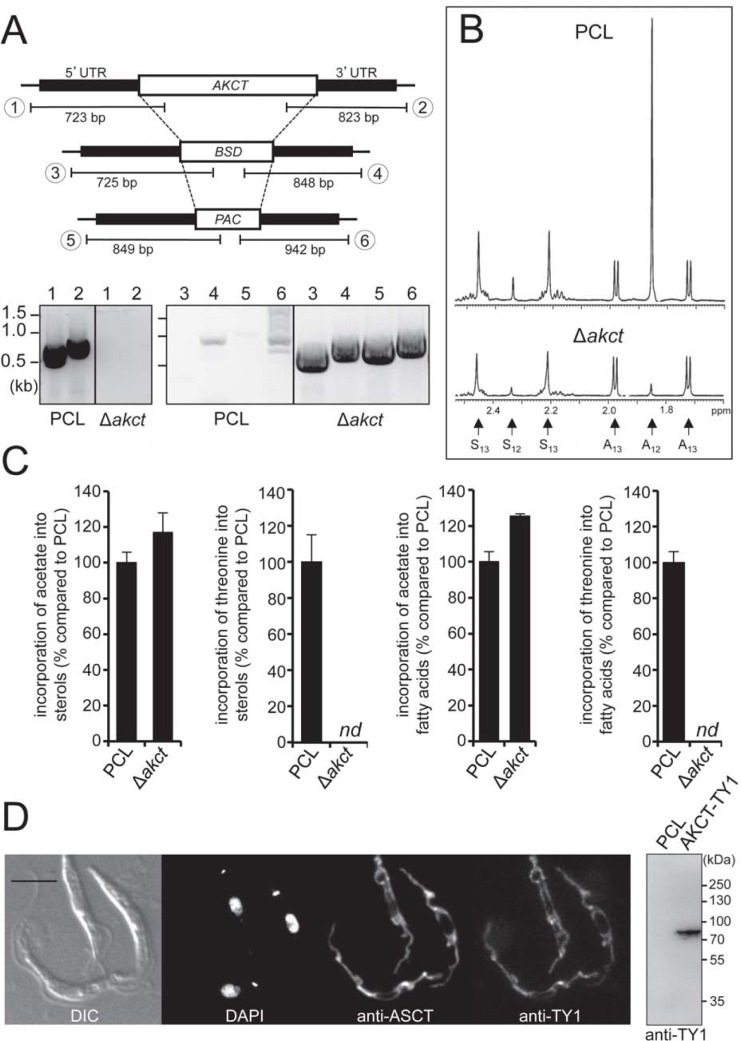
Fig 3. Characterization of the AKCT gene involved in threonine degradation.
(A) PCR analysis of genomic DNA isolated from the parental EATRO1125.T7T (PCL) and Δakct cells. Amplifications were performed with primers based on sequences flanking the 5’UTR and 3’UTR fragments used to target the AKCT gene depletion (black boxes) and primers binding the ORF of the AKCT gene (PCR products 1 and 2), or the blasticidin (BSD, PCR products 3 and 4) and the puromycin (PAC, PCR products 5 and 6) resistance genes. (B) NMR analysis of the EATRO1125.T7T (PCL) and Δakct cell lines using D-[U-13C]-glucose and threonine. Excretion of 13C-enriched succinate (S13) and acetate (A13) and non-enriched succinate (S12) and acetate (A12) is displayed. (C) L-[U-14C]-threonine and [1-14C]-acetate incorporation into sterols and fatty acids, of parental (PCL) and Δakct cell lines. [14C]-labelled fatty acid methyl esters and sterols were separated by HPTLC after transesterification and analyzed as described in the Materials and methods section. Error bars indicate mean ± SD of 3 biological replicates. Data are normalized with the parental cell line (PCL) values with an arbitrary value of 100 for the PCL samples. For more detail see Fig 2 legend. (D) Localization of the TY1-tagged AKCT by immunofluorescence microscopy, with the anti-ASCT immune serum used as mitochondrial marker. The right part of the panel shows a western blot of the parental (PCL) and TY1-tagged AKCT (AKCT-TY1) cell lines with the anti-TY1 immune serum. Differential interference contrast (DIC) of cells is shown to the left of the panel. Scale bar, 5 μm.

