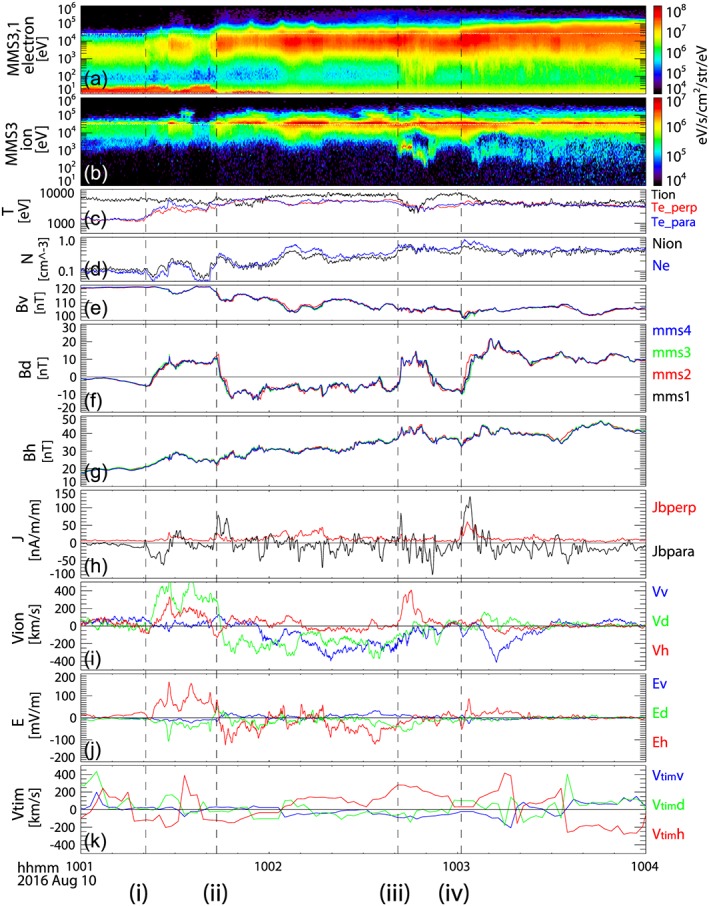
Figure 2.

Magnetospheric Multiscale observations between 10:01 and 10:04 on 10 August 2016. Energy spectra from (a) electrons and (b) ions obtained from Energetic Ion Spectrometer (EIS) and Fast Plasma Instruments (FPI). Electron spectra for energy lower/higher than 25 keV are plotted using FPI and EIS data. The EIS electron energy flux is multiplied by 2.75. Ion spectra for energy higher/lower than 30 keV are plotted using EIS/FPI data. (c) Electron perpendicular (red) and parallel (blue) temperatures, (d) ion (black) and electron (blue) density, and (e) V, (f) D, and (g) H components of the magnetic fields from the four MMS spacecraft. (h) The parallel (black) and perpendicular (red) components of the currents determined using the curlometer method. V (blue), D (green), and H (red) components of the (i) ion flow, the (j) electric field, and the (k) timing velocity. Plasma moments are calculated using FPI data. The vertical dashed lines show the start of the crossing times of the main current layers associated with the dipolarization: (i) 10:01:22, (ii) 10:01:43, (iii) 10:02:41, and (iv) 10:03:01.
