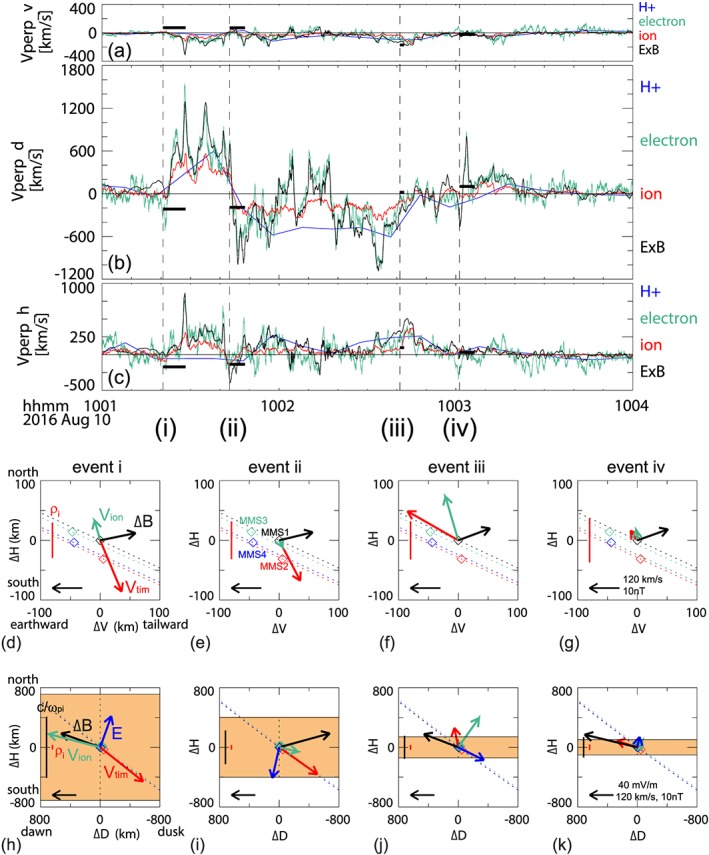
Figure 3.

Motion of the plasma and the boundary structures during the four field‐aligned current (FAC) events. (a) V, (b) D, and (c) H components of the flows perpendicular to the magnetic field. The black curves correspond to E × B drift, the red and green curves are the Fast Plasma Instruments ion and electron velocities, and the blue curves are the proton velocity from Hot Plasma Composition Analyzer. The horizontal black bars in (a)–(c) represent the timing velocities, and the vertical dashed lines indicate the start times of events (i)–(iv). The average direction of the field and flow disturbances during the events (i)–(iv) are summarized in (d)–(k). The average ion flows perpendicular to magnetic field (Vion, green), the timing velocity vector (Vtim, red), and the magnetic field disturbance vector (ΔB, black) during the four current sheet crossings (i–iv) are shown in (d)–(g) projected on the V‐H plane and in (h)–(k) projected on the D‐H plane. The electric field is also shown in dark blue in (h)–(k). The spatial scales: on ion‐gyro radius (red) and one inertial length (black), are shown as vertical bars. The estimated thickness of the FAC sheet is presented as orange area. The relative locations of the spacecraft to MMS 1 are also given together with the orbit direction (dashed line) in (d)–(g).
