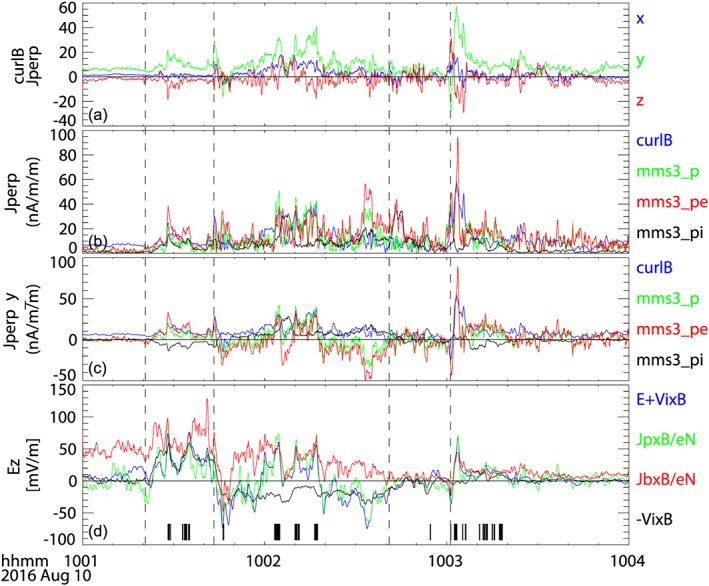
Figure 5.

Perpendicular current density estimated using fluxgate magnetometer data from the four Magnetospheric Multiscale (MMS; curlometer method) and using Fast Plasma Instruments measurement from MMS 3. (a) X GSM (blue), Y GSM (green), and Z GSM (red) components of the perpendicular current density obtained from the curlometer method. (b) Magnitude of the perpendicular current density. (c) Y GSM component of the perpendicular current density estimated from the curlometer (curlB, blue), particle currents from ion and electron (mms3_p, green), from electron (mms3_pe, red), and from ion (mms3_pi, black). (d) Z GSM components of the perpendicular electric field: E + Vi × B (blue), where E is the measured electric field double probe instrument electric field, Jp × B/eN (green), Jb × B/eN (red), and −Vi × B electric field (black). The black bars in (d) indicate times when the E + Vi × B coincides with both Jb × B/eN and Jp × B/eN within 30%. The vertical lines indicate the four field‐aligned current events.
