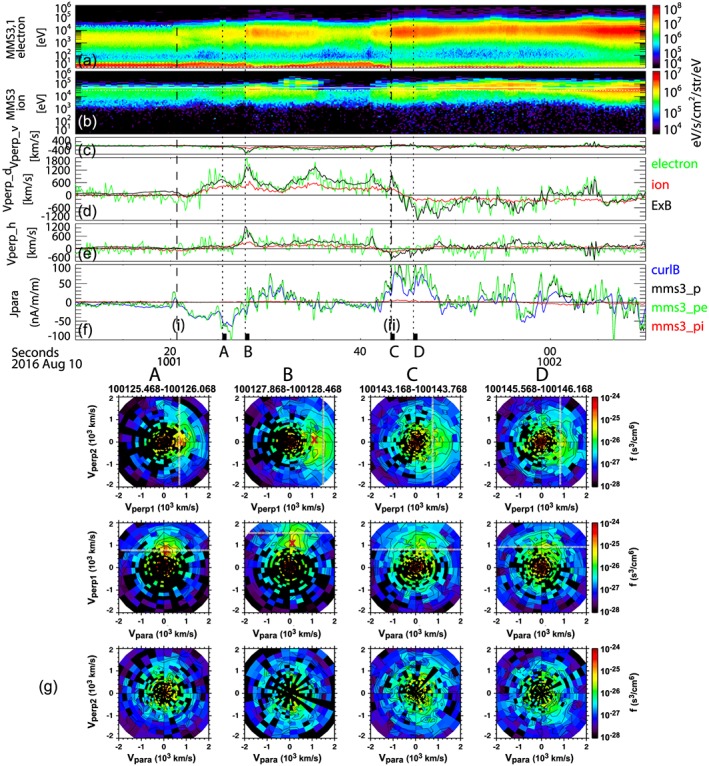
Figure 6.

(a) Ion and (b) electron energy spectra; (c) V, (d) D, and (e) H components of the perpendicular velocities of particle and E × B drift; and (f) parallel current densities estimated by curlometer and plasma. (g) Ion distribution during the selected times: t A, t B, t C, and t D marked at the bottom of (f), presented for three cuts in the Vperp1‐Vperp2 plane, in the Vpara‐Vperp1, and in the Vpara‐Vperp2 from top to bottom. E × B velocity is marked as a dashed line. “X” in the VDF cut t B in (g) shows the location of the peak around Vperp1 discussed in the text.
