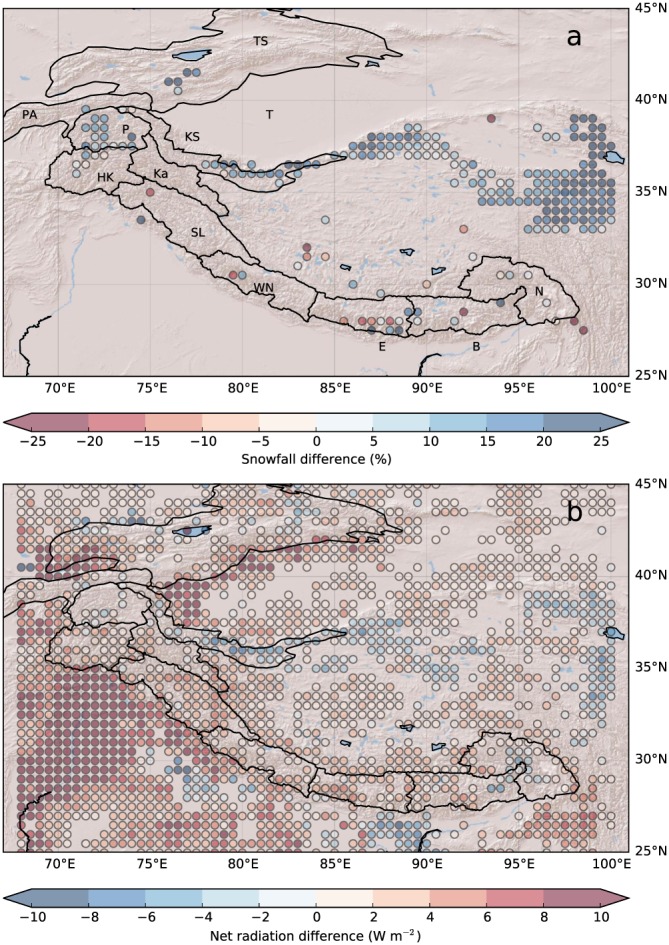
Figure 2.

Changes in summer snowfall (a) and summer net radiation (b) for the ΔHIST case. Data are averaged in 0.5 × 0.5° bins, and only differences with low P values (P < 0.01, including field significance) are plotted. Mountain ranges and the Tarim basin are indicated (TS = Tien Shan; PA = Pamir Alay; P = Pamir; KS = Kunlun Shan; Ka = Karakoram; HK = Hindu Kush; SL = Spiti Lahaul; WN = West Nepal; E = Everest; B = Bhutan; N = Nyaingentangla; T = Tarim).
