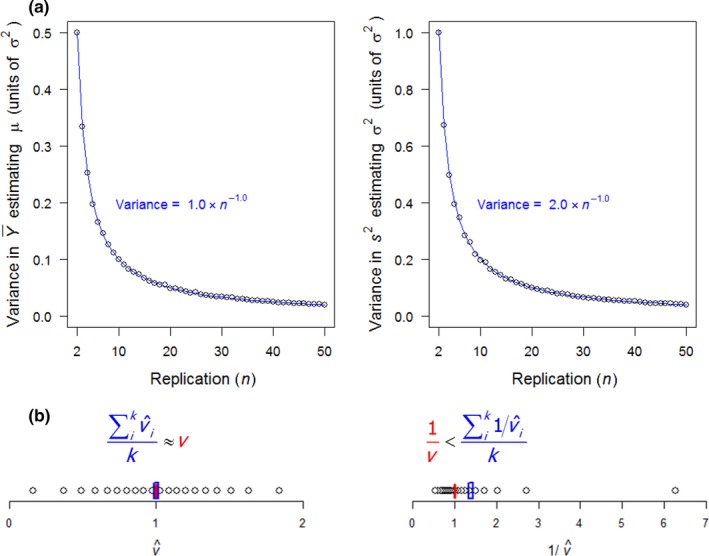
Figure 2.

Replication‐dependent variability in estimating the mean and variance. (a) Points show variances in (left‐hand graph) and in s 2 (right‐hand graph) from 10,000 replicate samples of n observations of a normal distribution with mean μ and SD σ. The error in estimating μ is the ‘error variance’: v = σ2/n (left‐hand graph); the error in s 2 estimating σ2 is 2v (right‐hand graph). (b) Example of k = 20 observations of sampled from a normal distribution around v = 1 (left‐hand graph); inversion imposes right skew, with the distribution of having mean exceeding 1/v, in this case by 39% (right‐hand graph). Consequently, the true meta‐variance, v/k, exceeds the estimated meta‐variance, by the same proportion
