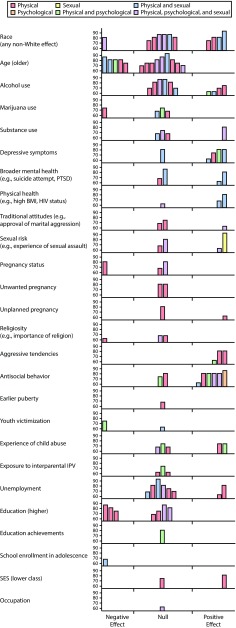
FIGURE 2—
Harvest Plots of Prospective–Longitudinal Risk and Protective Factors for Intimate Partner Violence Against Women at the Individual Level
Note. BMI = body mass index; IPV = intimate partner violence; PTSD = posttraumatic stress disorder; SES = socioeconomic status. Each bar represents an individual study, with the position of the bar indicating whether the findings suggested a negative (risk), null, or positive (protective) effect of the factor on IPV against women. Null (i.e., statistically nonsignificant) results may become statistically significant when pooled together and should not be taken to indicate clinical insignificance. Where necessary, study findings were reinterpreted so that all studies in a single category could be interpreted in the same direction. The height of the bars indicates the quality score limited to the range among included studies (60%–100%). The color of the bar indicates the IPV outcome analyzed in the study. For a harvest plots of all factors at the individual, Relational, community levels, see Figure A (available as a supplement to this article at http://www.ajph.org).

