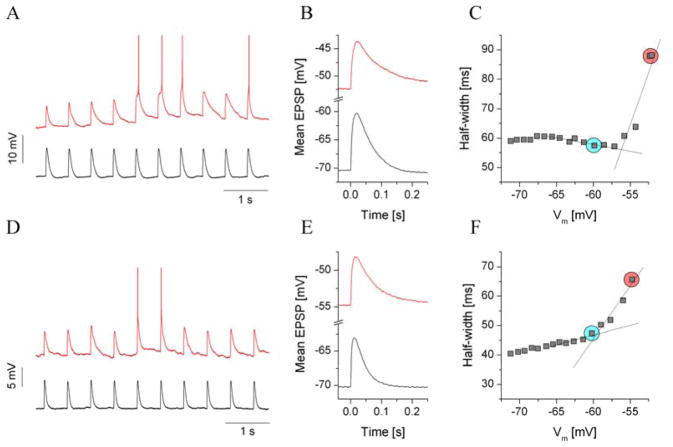
Fig. 4.
Analysis of EPSP amplification using dynamic clamp and simulated excitatory synaptic inputs. a: Voltage output of a control type III neuron in response to 10 EPSP inputs at −70 mV membrane potential (black trace) and near spike threshold (−52 mV, red trace). b: Average EPSP waveforms calculated from the corresponding traces in a. The voltage dependence of the EPSP half-width is shown in c. The red circle indicates the EPSP half-width near spike threshold, and the cyan circle shows the reference value at −60 mV. There was a prominent jump in the EPSP half-width as the membrane potential approached the spike threshold. A type III neuron from a dependent animal (d) exhibited weaker EPSP amplification than the control (f vs. c)

