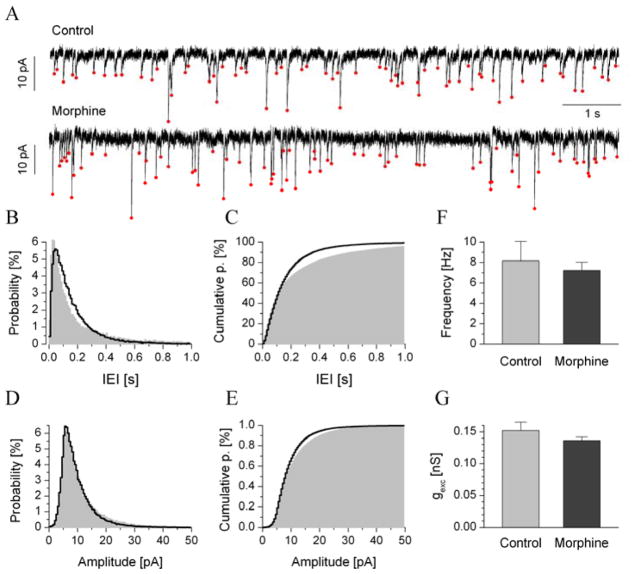
Fig. 6.
The average frequencies and amplitudes of spontaneous EPSCs of type III neurons did not significantly differ from controls. a shows representative traces of transmembrane current (10 s sections) recorded from type III neurons of control and dependent animals (Vhold = −70 mV). Average probability distributions and cumulative probabilities are shown in b and c, respectively (gray areas for controls, n = 11; black lines for dependent, n = 17). The relative count of both short (< 0.1 s) and long (> 0.5 s) IEIs was slightly reduced in cells of dependent animals compared with controls. This produced a more steeply rising cumulative IEI histogram in c. sEPSC amplitudes were analyzed in a similar manner (d and e) using histograms in the 0–50 pA range. The mean sEPSC frequency and amplitude from the pooled data are shown in f and g, respectively.

