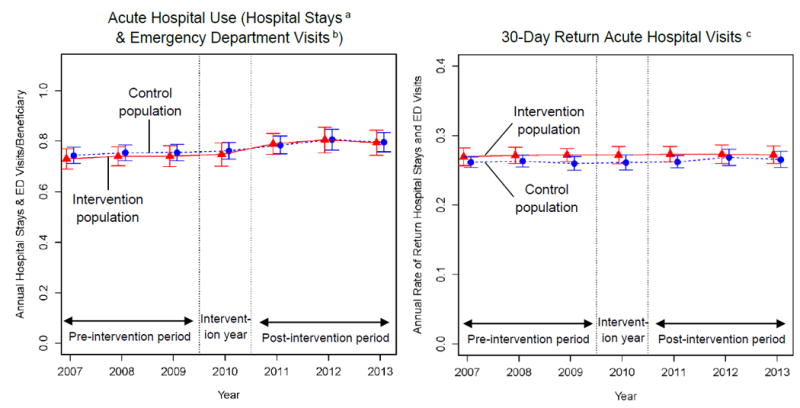
Exhibit 2. Trends in acute hospital utilization among Medicare beneficiaries in the intervention and control populations, 2007-2013.

These graphs show unadjusted annual rates of acute hospital utilization for the intervention and control populations. The error bars denote 95% confidence intervals and were calculated using standard errors clustered at the ZIP code level. Because Maryland’s global budget program for rural hospitals was implemented in July 2010, we omitted 2010 from our regression analyses. Separate trends for hospital stays and emergency department visits that did not lead to an admission and are plotted in Appendix Exhibit 8.
a Hospital stays include inpatient admissions and observation stays. See Section 3 of the Appendix and the notes to Exhibit 4 for additional information about the measures’ construction.
b Emergency department visits that did not lead to an inpatient admission.
c Annual proportion of patients’ inpatient admissions, observation stays, and emergency department visits followed within 30 days by a second inpatient, emergency department, or observation visit. Assessed annually among patients with ≥1 inpatient admission, emergency department visit, or observation stay during the study year.
