
Exhibit 3. Trends in price-standardized acute and outpatient hospital spending among Medicare beneficiaries in the intervention and control populations, 2007-2013.
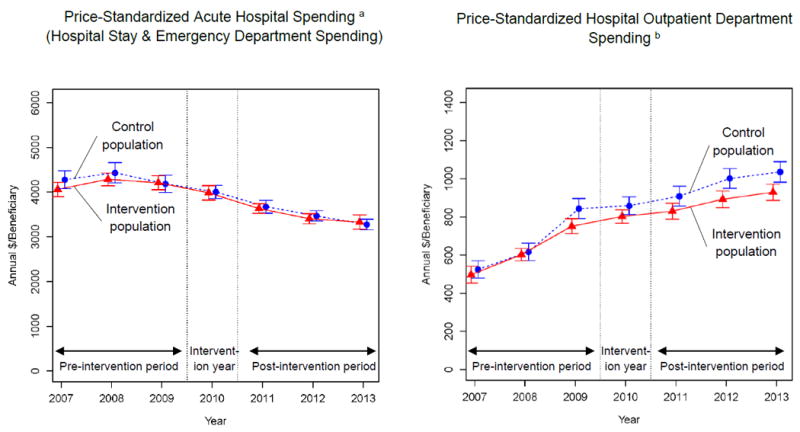
These graphs show unadjusted annual price-standardized spending for acute and outpatient hospital services in the intervention and control populations. The error bars denote 95% confidence intervals and were calculated using standard errors clustered at the ZIP code level. Because Maryland’s global budget program for rural hospitals was implemented in July 2010, we omitted 2010 from our regression analyses. Separate trends for price-standardized spending associated with hospital stays and emergency department visits that did not lead to an admission are plotted in Appendix Exhibit 8.
a Defined as the sum of price-standardized spending associated with hospital stays (inpatient admissions and observation-unit stays) and non-admitted emergency department visits. Because hospital prices were subject to change under Maryland’s global budget program, we price-standardized spending by applying mean national prices (measured annually at the level of Diagnosis-Related Groups for inpatient claims, revenue codes for observation-unit claims, and procedure codes for non-admitted emergency department claims) to claims for the corresponding categories of acute hospital use. Mean prices were calculated annually using Medicare claims from hospitals outside of Maryland. See Section 3 of the Appendix for additional information about the measures’ construction.
b We price-standardized spending for hospital outpatient department services, excluding emergency department visits and observation stays, by applying national average procedure code-level prices to hospital outpatient department claims. Standardized prices were assessed annually from national Medicare claims, excluding hospitals in Maryland.
Source: Authors’ analyses of fee-for-service Medicare claims for the periods 2007–2009 and 2011–2013.