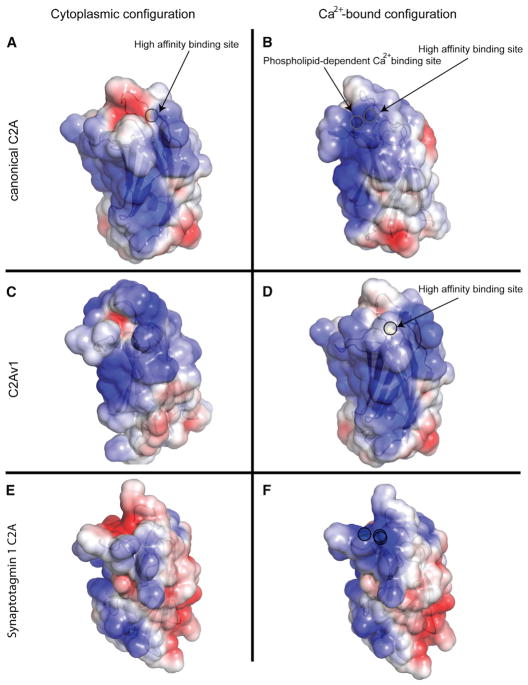
Figure 6. Electrostatic Surface Potential of Dysferlin C2 Domains.
(A and B) The canonical C2A domain with (A) a single Ca2+ and canonical C2A with two Ca2+ (B).
(C and D) Dysferlin C2Av1 with no ligand (C) and a single Ca2+ (D). Solvent-accessible surface is colored by the calculated electrostatic potential and displayed at ± 3 kT/e. Calcium ions are highlighted by a circular outline.
(E and F) The electrostatic surface potential representation of synaptotagmin 1 C2A with and without (E) and with (F) saturating Ca2+ (1byn) is shown for comparison (Shao et al., 1998). Calcium ions are highlighted by a circular outline.

