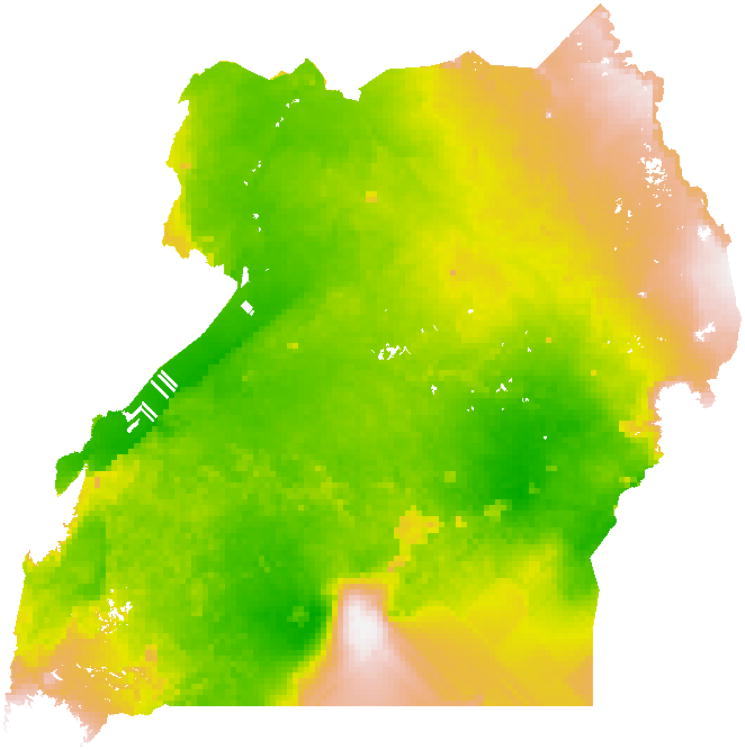
Figure 5.
Malaria Atlas Project parasite prevalence data used in subsequent analyses. Data provided in this raster file pertained to parasite prevalence throughout the study area, with cell values corresponding to probabilities between zero and one. Prevalence ranged from 0 (white) to 0.60 (green), with the color scheme of orange to yellow representing prevalence values ranging approximately between 0.20 to 0.40.

