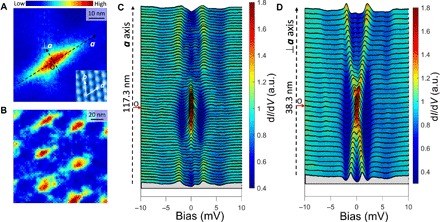
Fig. 3. Vortex image and vortex core states.

(A) Zero-bias differential conductance map of a single vortex. The inset shows the topography measured near the vortex, and the vortex is elongated along the a axis. (B) Spectroscopic image of the vortex lattice consisted of elongated vortices measured at zero bias. This elongated vortex shape is very different from that in the bare FeTe0.55Se0.45 because of distinct values of Fermi energies. (C and D) Tunneling spectra measured along a axis and perpendicular to a axis directions, respectively. The curves marked by the red arrow represent the spectrum measured at the center of the vortex core. It should be noted that the dark dashed lines in (A) only denote the directions of the spectra measurements but do not represent the spatial distance of the measurements. The spectra shown in (C) and (D) are taken along much longer lines than those shown in (A), and the real spatial distance for measuring spectra is given by the vertical dashed arrowed line on the left-hand side of each panel. All data in this figure are taken at T = 0.4 K and B = 0.7 T with Vset = 10 mV and Iset = 50 pA.
