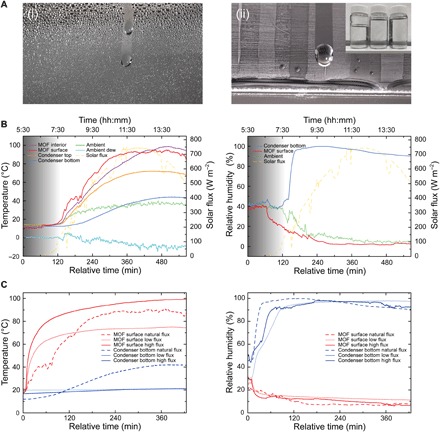
Fig. 3. Water production and temperature, RH, and solar flux profiles.

(A) Photographs of the condenser showing (i) the formation of droplets (ii) flowing to make puddles (inset, water produced per day-and-night desert cycle). (B) Humidity and temperature profiles acquired during testing in the desert on 22 October 2017 in Scottsdale, AZ, USA. Temperature and humidity sensors were placed at different positions within the water harvester: at the bottom (orange) and top of the condenser (blue) and at the surface of (red) and in the MOF powder (magenta). The solar flux was recorded using a pyranometer mounted on the reflector. Ambient temperature and RH were monitored near the water harvester, and the ambient dew temperature (light blue) was calculated from these data. (C) Comparison of humidity and temperature profiles acquired under ambient solar flux during testing in the desert and under laboratory conditions using low (558 W m−2) and high (792 W m−2) fluxes. The origin represents when the complete surface of MOF-801/G was exposed to artificial or ambient solar radiation, for the laboratory experiments and the desert test, respectively.
