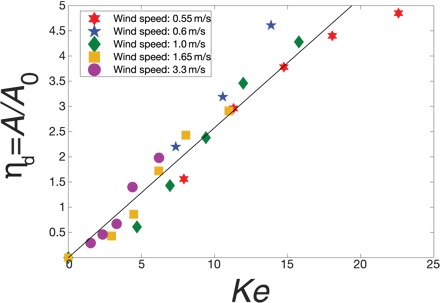
Fig. 3. Dependence of the deposition efficiency on the electrical number.

The data correspond to five values of the wind speed and five values of the voltage. The colors represent different wind speeds (red, 0.55 m/s; blue, 0.6 m/s; green, 1 m/s; yellow, 1.65 m/s; purple, 3.3 m/s). The solid line is a linear fit (R2 = 0.92), with a slope of 0.26.
