
Figure 2.
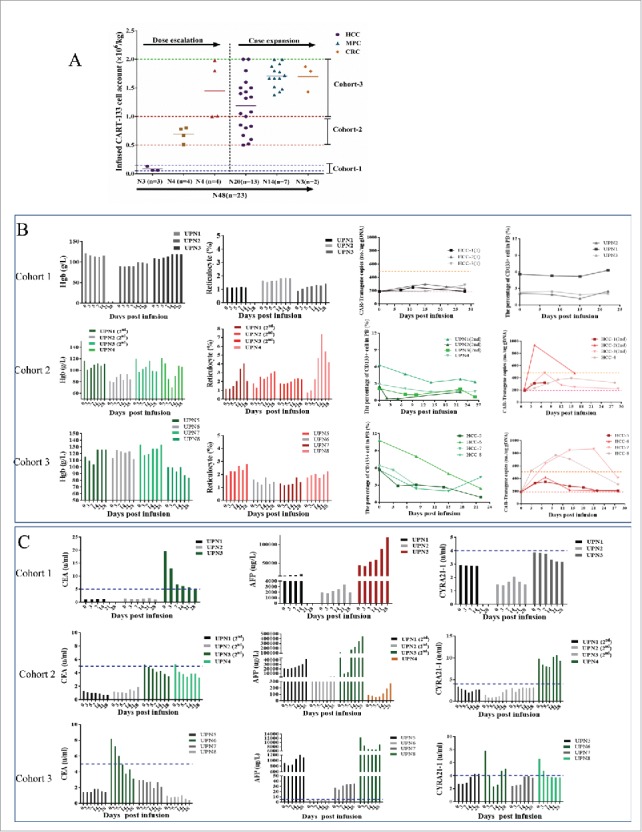
CART-133 cell dose escalation. (A) Dose group and CART-133 infusion cell dose pattern in all patients. (B) Hemoglobin (Hgb), reticulocyte, CD133+ cells and CAR-gene copy numbers in PB were detected before and at serial time points after CART-133 cell infusion in each patient from every cohort. (C) Tumor biomarkers in serum from each patient were detected before and at serial time points after CART-133 cell infusion. The blue dashed line on the plots is the normal range of each tumor biomarker. Red represents the increase, and green represents the decrease. N = cell infusion cycle; n = case number.