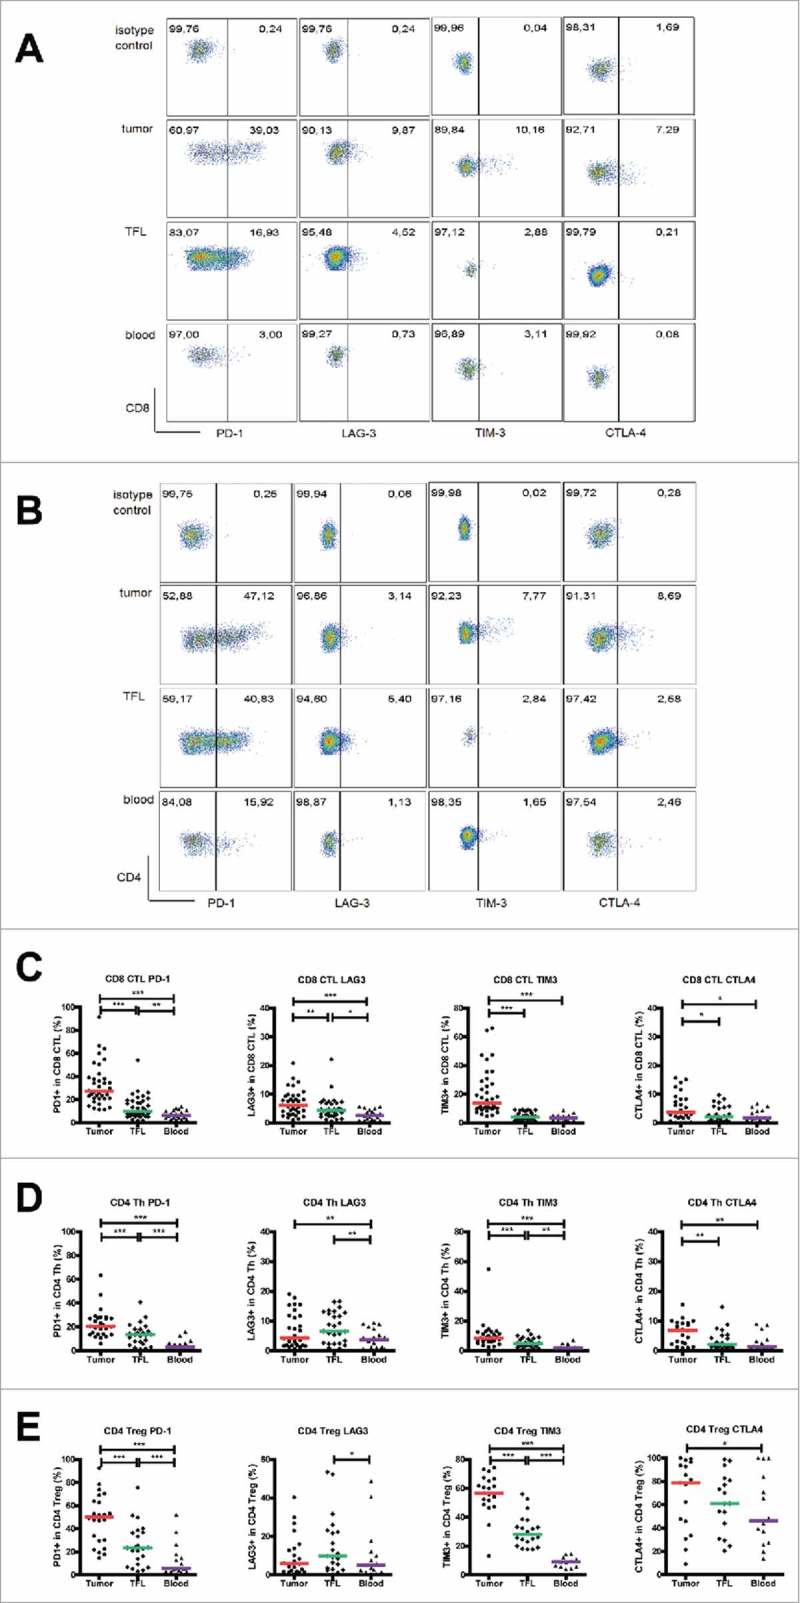
Figure 2.

Expression of inhibitory receptors on CD8+ CTL, CD4+ Th and CD4+ Treg in the tumor, TFL and blood of MMR-proficient LM-CRC. PBMC and leukocytes isolated from LM-CRC tumors and TFL were stained with antibodies against PD-1, LAG3, TIM3 and CTLA4. (A) (B) Representative dot plots of inhibitory receptor expression on (A) CD3+CD8+ CTL and (B) CD3+CD4+Foxp3− Th in the tumor, TFL and blood; the gates were made according to appropriate isotype controls. (C) (D) (E) The frequencies of inhibitory receptor positive cells within (C) CD8+ CTL, (D) CD4+Foxp3− Th and (E) CD4+Foxp3+ Treg in the tumor, TFL and blood. Values of individual patients are shown, and lines depict medians. Differences were analyzed by paired t test or Wilcoxon matched pairs test; *p < 0.05, **p < 0.01, ***p < 0.001.
