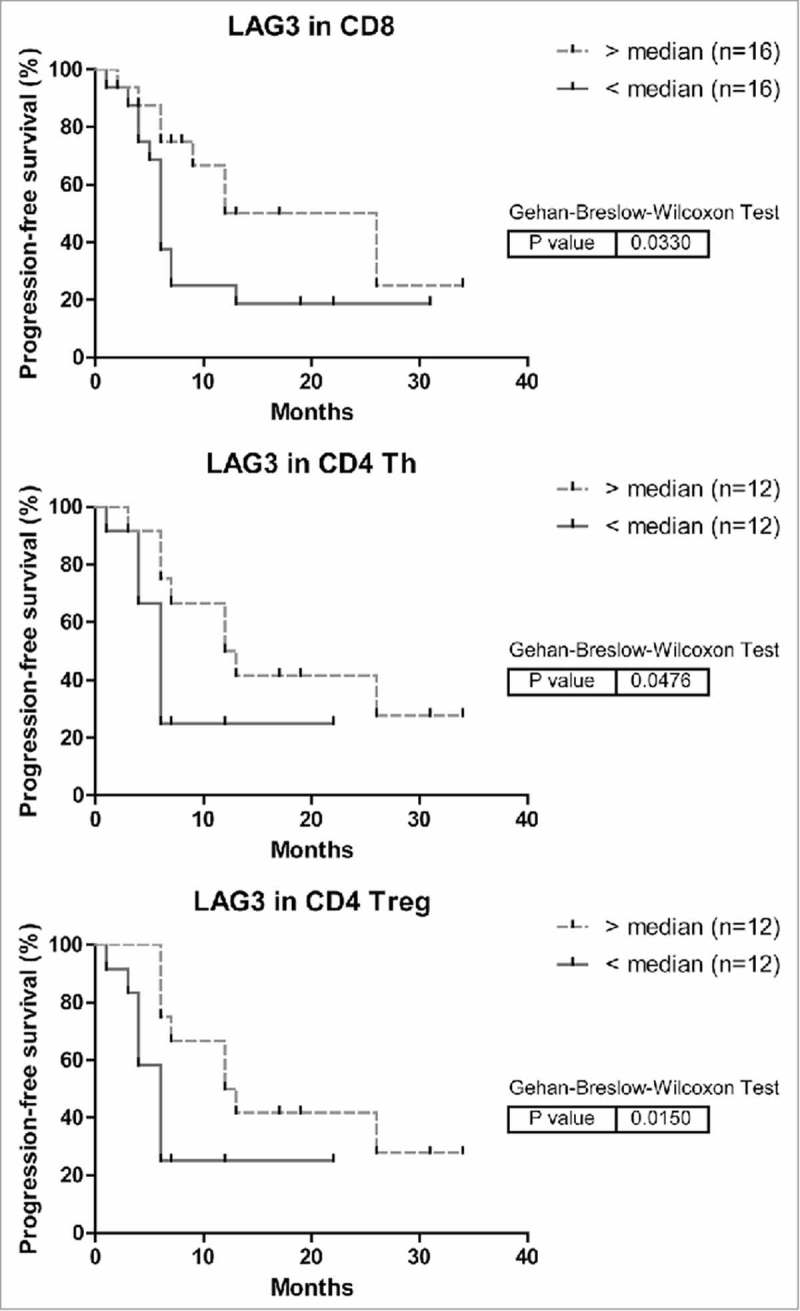
Figure 7.

Kaplan-Meier curves of progression-free survival (time to recurrence) in relation to LAG3 expression on intra-tumoral T cells in MMR-proficient LM-CRC. The cutoff values to divide the patients into two groups are the median percentages of LAG3+ cells in tumor-infiltrating CD8+ CTL, CD4+Foxp3− Th or CD4+Foxp3+ Treg cells. For determination of the p values the Breslow test was used.
