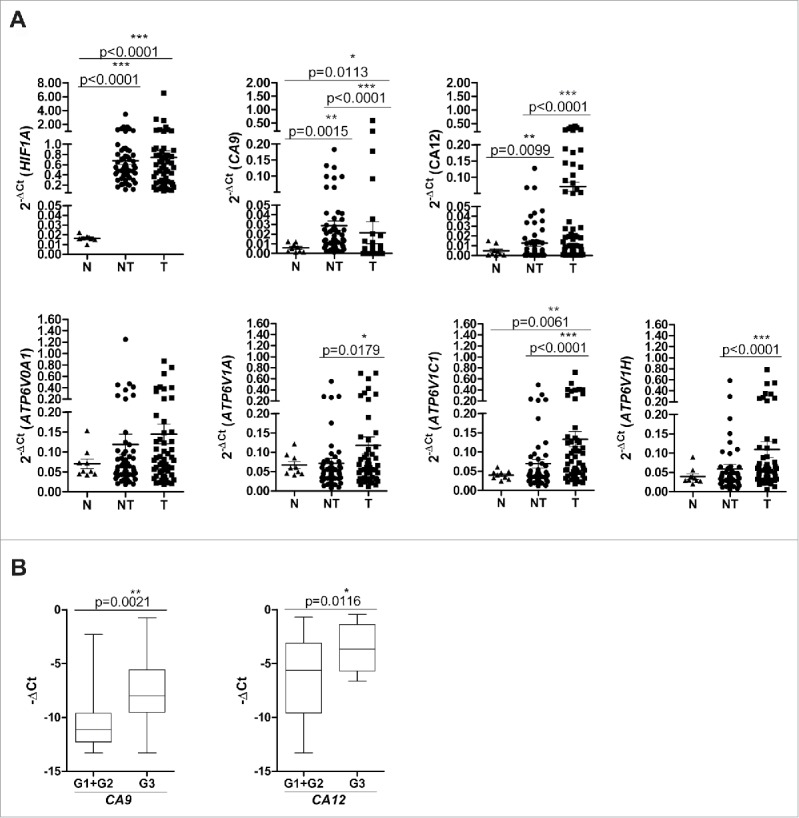
Figure 1.

Gene expression of pH regulatory molecules in liver tissues. (A) mRNA expression levels of HIF1 A, CA9, CA12, ATP6V0A1, ATP6V1 A, ATP6V1C1 and ATP6VIH. The expression of the indicated genes was evaluated in 9 normal (N) and 57 paired samples of adjacent non-tumor (NT) and tumor (T) liver tissues (see Materials and Methods for the statistical analyses used). The data are reported as 2−ΔCt values (ΔCt = Cttarget gene–CtGAPDH). (B) High expression of CA9 and CA12 was associated with poorly differentiated HCC (G3). Gene expression data of 57 tumor tissues analyzed were reported as –ΔCt values. The reported p-values were calculated by the unpaired t test.
