Figure 3.
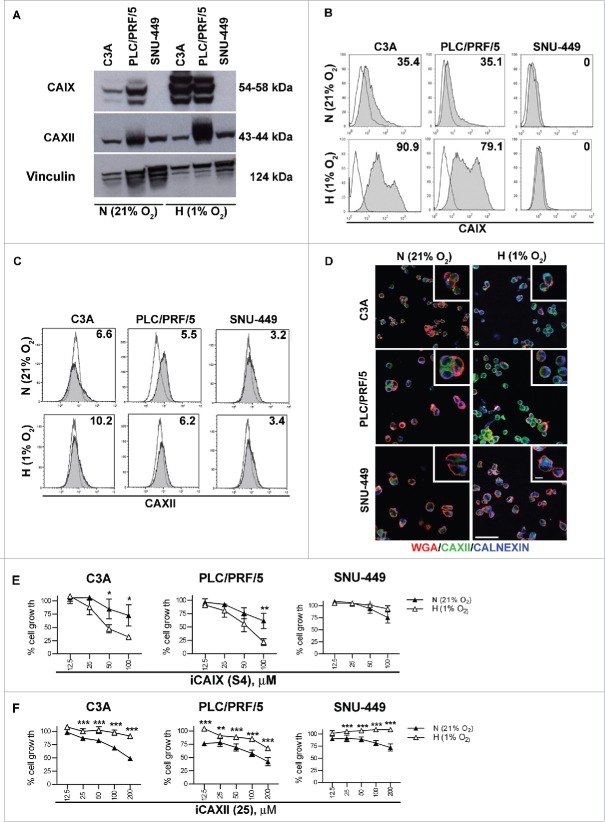
CAIX and CAXII expression and functional inhibition in HCC cell lines. The indicated HCC cell lines were cultured under either normoxic (N = 21% O2) or hypoxic (H = 1% O2) conditions for 72 h and were analyzed as indicated below. (A) The protein expression of CAIX, CAXII and vinculin was assessed by western blotting in cell lysates of the C3A, PLC/PRF/5 and SNU-449 cell lines. The cell surface expression of CAIX (B) and CAXII (C) was evaluated by flow cytometry. The number in each histogram plot shows the percentage of cells positive for the indicated markers (filled histograms) evaluated with respect to the corresponding secondary antibody (black line). Representative histograms from three independent experiments are shown. (D) The cellular distribution of CAXII was assessed by confocal laser scanning microscopy under the indicated conditions. Representative micrographs of triple immunofluorescence staining with anti-CAXII (green), anti-WGA (red, detecting the cell membrane) and anti-calnexin (blue, detecting the ER compartment) are reported. Scale bars = 50 μm and = 5 μm for the lower and higher magnification respectively. The cell viability of the HCC cell lines treated with different doses of S4 (µM) (E) and compound 25 (µM) (F) under normoxia (N = 21% O2, black triangles) or hypoxia (H = 1% O2, white triangles) for 72 h was evaluated using the MTT assay. The data show the percentage of viable cells of the untreated control and represent the mean of six replicate reactions from 3 independent experiments. IC50 values for S4 were >100 μM for all HCC cell lines grown under normoxic conditions and 57.4, 53.9 and >100 μM for C3 A, PLC/PRF/5 and SNU-449 exposed to hypoxia respectively. For compound 25, C3 A, PLC/PRF/5 and SNU-449 cells grown under normoxia displayed IC50 values of 198.5, 142.9 and >200 μM respectively. All the HCC cell lines exposed to hypoxia displayed IC50 values >200 μM for compound 25.

