Figure 6.

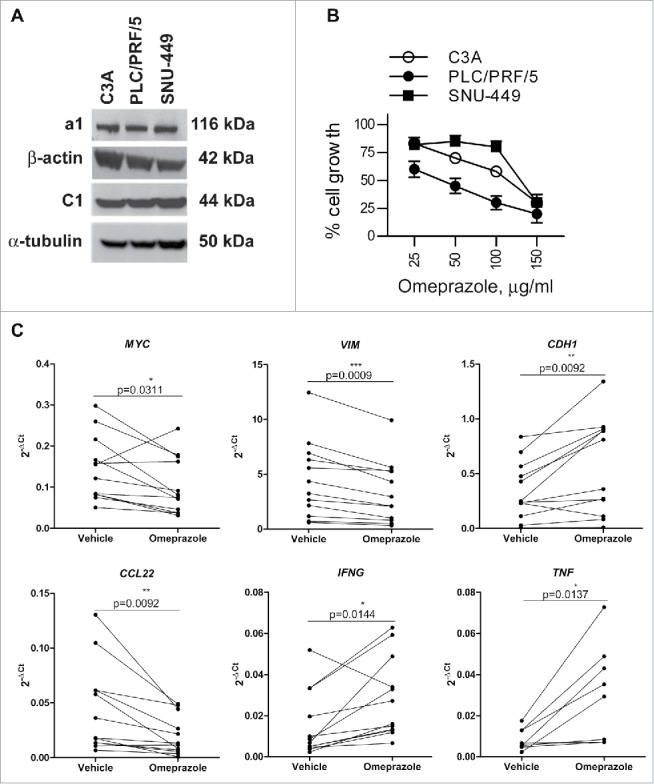
Effects of omeprazole on HCC cell line viability and on the tumor microenvironment of HCC tissue explants. (A) The protein expression of a1, C1, β-actin and α-tubulin was assessed by western blotting in cell lysates of the C3A, PLC/PRF/5 and SNU-449 cell lines. (B) The HCC cell lines were treated with different doses of omeprazole, and cell viability was evaluated using the MTT assay. The data on the y-axes report the percentage of viable cells of the untreated control and represent the mean of six replicate reactions from 3 independent experiments. The calculated IC50 values for omeprazole are 100.9, 39.4, and 128.4 μg/ml for C3A, PLC/PRF/5 and SNU-449 respectively. (C) Expression levels of the indicated genes in HCC tissue explants (MYC, VIM, CDH1, CCL22, IFNG N = 12; TNF, N = 8) cultured ex vivo in the presence of 100 μg/ml omeprazole or the vehicle of the drug for 24 h. The gene expression data are reported as 2−ΔCt values. The p-values are calculated by the paired t test comparing cells treated with omeprazole or the vehicle.
