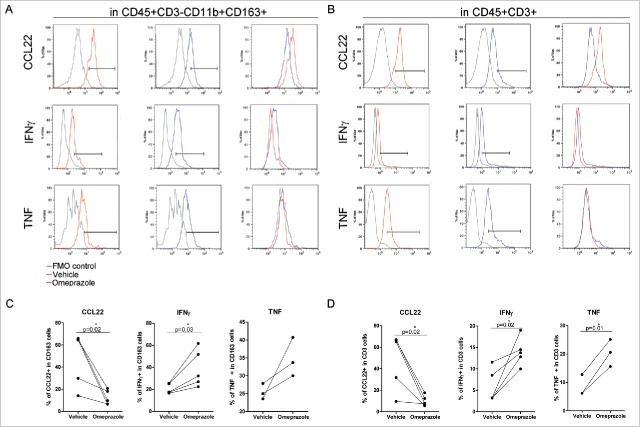
Figure 7.
Modulation of the cytokine profile in HCC immune-infiltrating cells by omeprazole treatment. (A-D) Multiparametric flow cytometry of live cells in freshly dissociated HCC tumors treated with the drug vehicle (red line) or with omeprazole (100 μg/ml, blue line) for 24 h. IFNγ, TNF and CCL22 production was evaluated by intracellular staining (A) in CD163+ myeloid cells gated inside live CD45+CD3− cells and (B) in CD3+ T cells gated inside live CD45+ cells. FMO control for each cytokine (gray line) is reported in the histogram plot. The percentages of IFNγ-, TNF- and CCL22-positive cells in the CD163+ and in the CD3+ cells are shown in C and D respectively. The p-values are calculated by the paired t test comparing cells treated with omeprazole or the vehicle.

