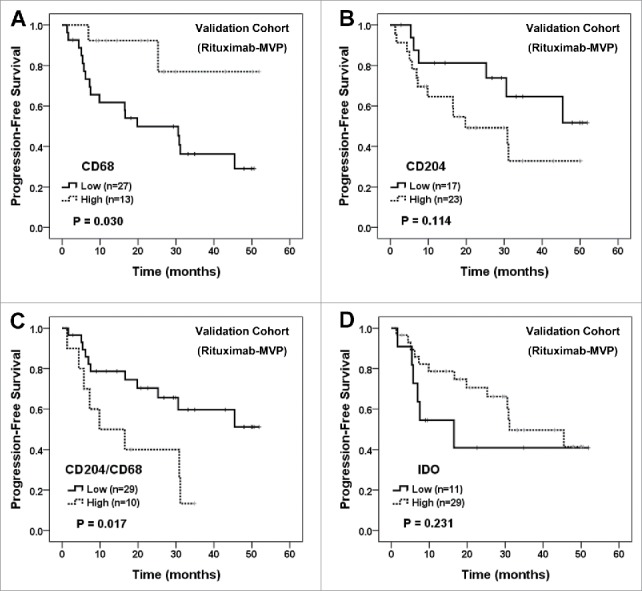
Figure 5.

Survival analysis of independent validation cohort of primary CNS-DLBCL patients treated with rituximab-MVP according to CD68+, CD204+, and IDO+ cells and the ratio of CD204+/CD68+ cells. PFS of patients were evaluated according to the tumor-infiltrating CD68+ cell number (A), CD204+ cell number (B), the ratio of CD204+/CD68+ cells (C), and IDO+ cell number (D). Kaplan-Meier curves are shown with P values generated by log-rank test.
