
Figure 2.
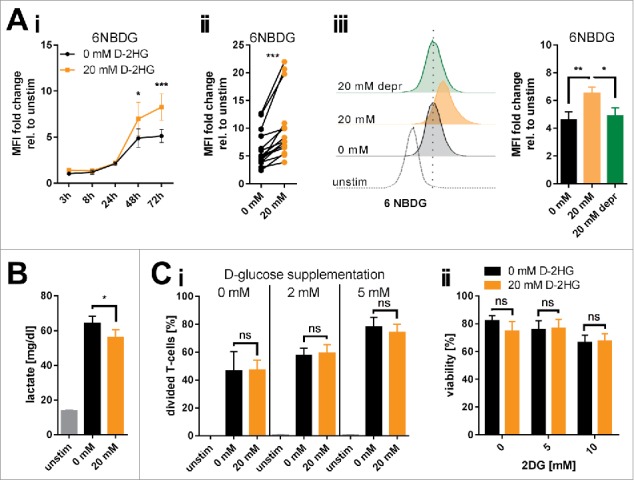
Changes of glucose metabolism induced by exogenous D-2HG. A) The increase in glucose uptake induced by 20 mM D-2HG supplementation was measured by flow cytometry (FACS) using a fluorescent glucose analog (6NBDG) in a time course (Ai, n = 5-11) or after 72 h (Aii, n = 15) of T-cell culture. D-2HG was subsequently removed from the culture and glucose uptake levels measured again after 72 h (Aiii, 20 mM depr, green bar, n = 5). Each pair of values in panel ii represents T-cells isolated from one particular donor under different culturing conditions. B) Lactate secretion into the cell culture supernatant as a surrogate for glycolysis was measured after 72 h (B, n = 10). C) To evaluate a putative glucose-dependency created by exogenous D-2HG application T-cells were analyzed in terms of their proliferative capacity in presence of reduced glucose availability in the culture medium (Ci, n = 3), and of viability upon hexokinase-2 inhibition by 2DG (Cii, n = 3) after 72 h of culture. T-cells were either unstimulated (unstim, grey) or stimulated without (0 mM, black) or with (20 mM, orange) D-2HG. FACS histograms show one representative analysis. * p<0.05; ** p<0.01; *** p<0.001; ns: not significant.