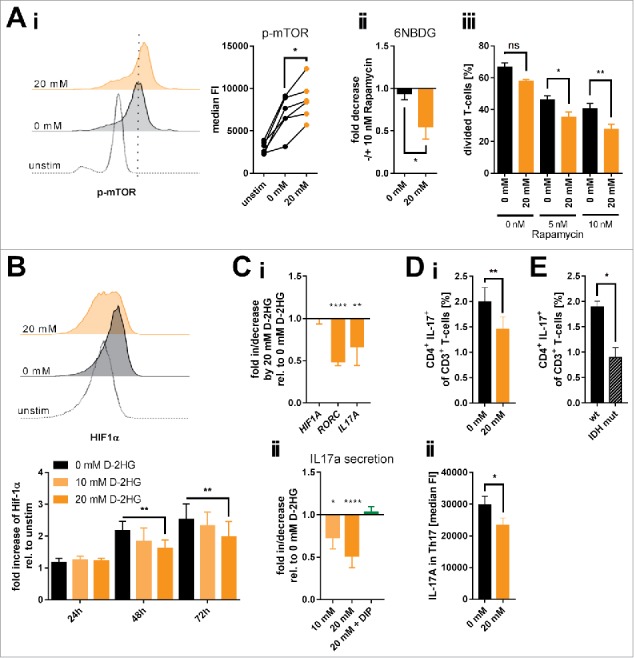
Figure 5.

Influence of exogenous D-2HG on mTOR activation, HIF-1α protein stability and resulting Th17 formation. A) Activation of the mTOR signaling pathway (Ai; n = 6) as a function of the level of mTOR phosphorylation (p-mTOR) and the impact of mTOR inhibition by rapamycin on glucose uptake (Aii; n = 4) and T-cell proliferation (Aiii; n = 3) upon D-2HG treatment were measured by flow cytometry (FACS). Each pair of values in panel i represents T-cells isolated from one particular donor under different culture conditions. B) In addition, HIF-1α protein expression levels were analyzed by FACS showing one representative FACS analysis after 72 h (upper panel) and the averages of repeated measures in a time-course (n = 3, lower panel). C) Relative gene expression of HIF1A, RORC, and IL17A (Ci, n = 8-23) and IL-17A secretion (Cii, n = 5-10) by in vitro cultured T-cells treated for 24 h with D-2HG were measured by quantitative real-time PCR and sandwich-ELISA, respectively. In addition, IL-17 secretion was measured in the presence of the hypoxia mimetic DIP that stabilizes HIF-1α (green bar). D) Anti-CD2/CD3/CD28 stimulated T-cells were restimulated after 72 h of culture with PMA/Ionomycin in the presence of GolgiPlug™ for 4 h and analyzed for the Th17 frequency (i, n = 8) and the intracellular IL-17 A content (ii, n = 8). E) Finally, PBMCs from AML patients without (wt) and with IDH mutation (IDH mut) were compared by flow cytometry for their Th17 frequency after 4 h of in vitro stimulation with PMA/Ionomycin in the presence of GolgiPlug™ (n = 3-7). T-cells were either unstimulated (unstim) or stimulated in the absence (0 mM, black) or presence (orange) of D-2HG at the given concentrations. FACS histograms show one representative analysis. * p<0.05; ** p<0.01; *** p<0.001; **** p<0.0001; ns: not significant.
