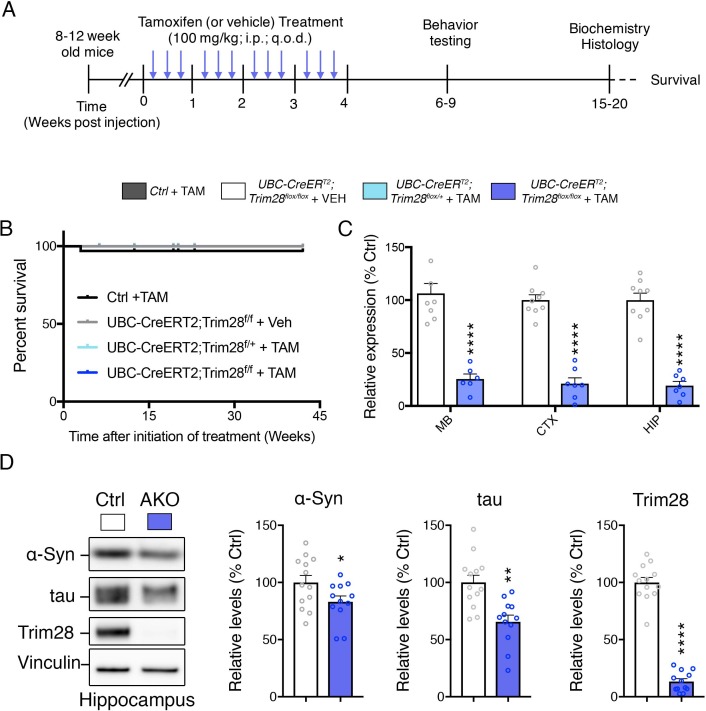
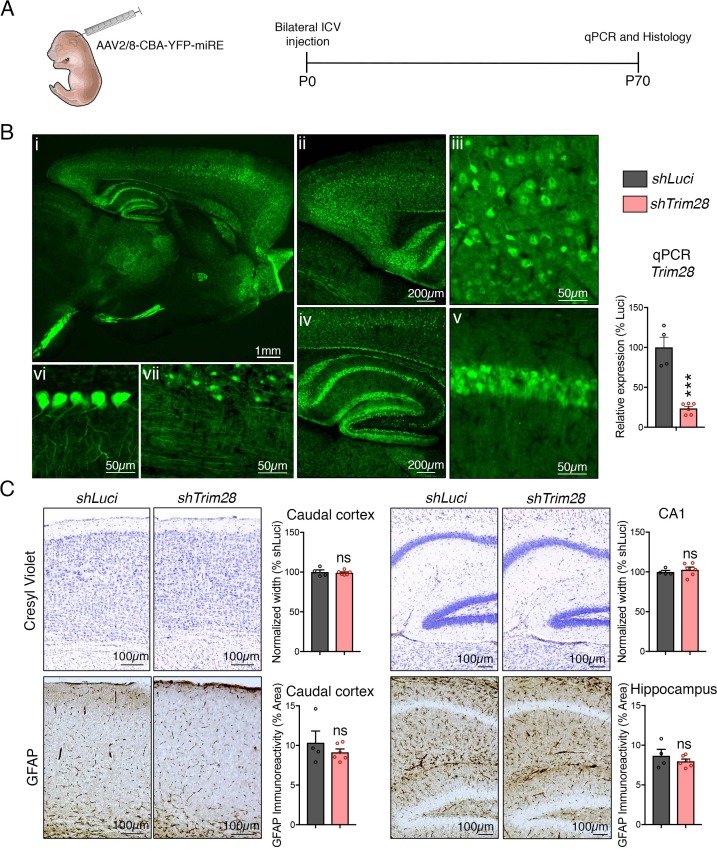
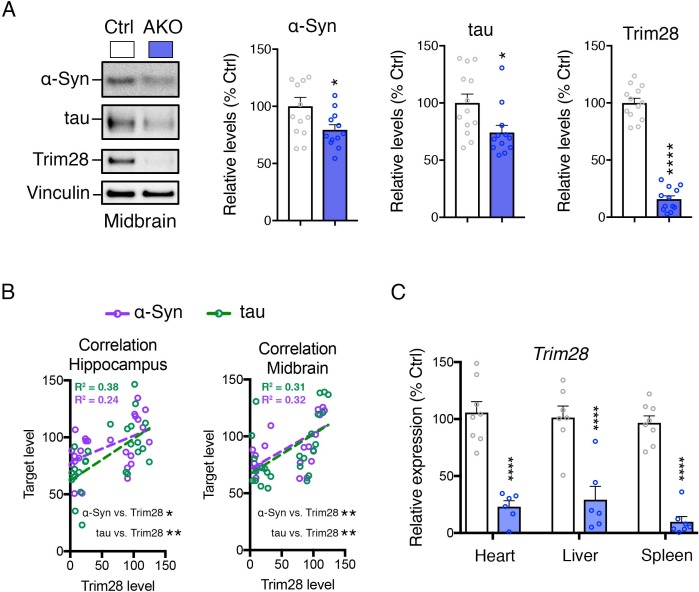
Figure 2. Trim28 adult knockout mice are viable and demonstrate reduced α-Syn and tau levels.
(A) Experimental approach to delete Trim28 from the adult body. (B) Kaplan-Meier survival curve of Adult knockout mice (UBC-CREERT2; Trim28flox/flox + TAM vs littermate controls). No significant differences in survival are observed. (C) qPCR analysis for Trim28 expression in midbrain (MB), cortex (CTX) and hippocampus (HIP) of Trim28 adult knockout mice and control littermates. (D) Western blot analysis of α-Syn, tau and Trim28 levels in hippocampi from Trim28 adult knockout mice and control littermates. In (B), n = 14–33 per group. In (C and D), n = 12–13 per group.


