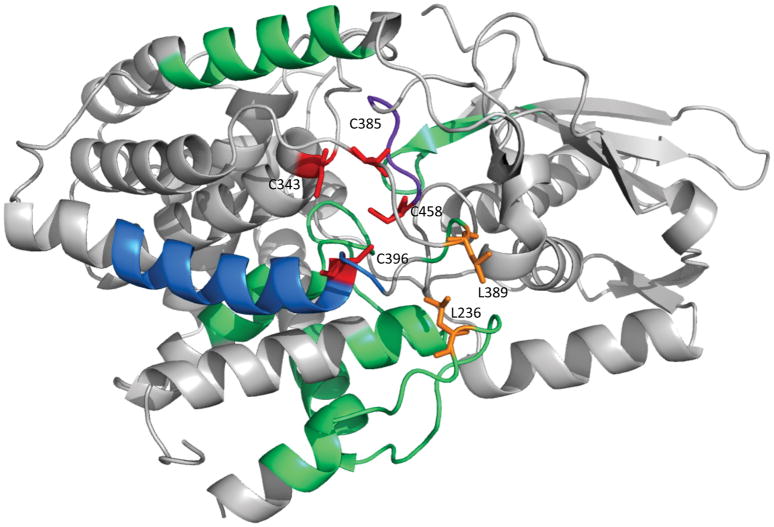
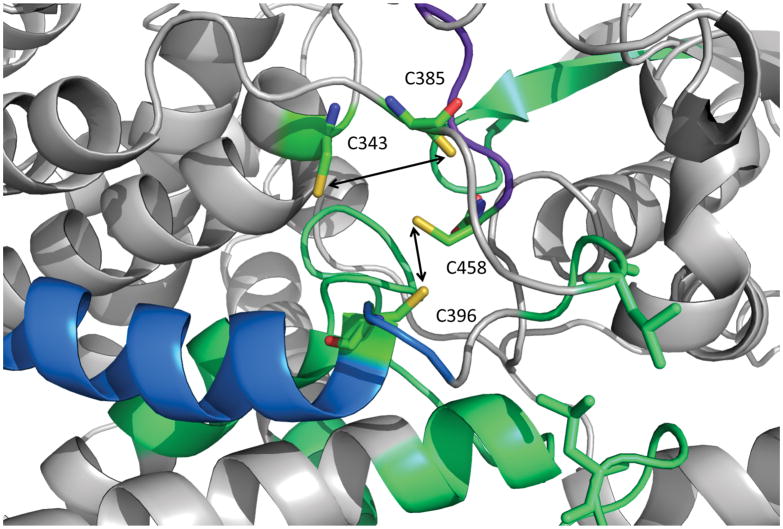
Figure 4. Structural analysis of L-serine dehydratase HDX kinetics.
Exchange rates are mapped onto the serine dehydratase crystal structure of the holo enzyme (PDB 4RQO). Regions exhibiting the largest difference (ΔD% > 40%) are colored purple; regions exhibiting a medium difference (40% > ΔD% > 20%) are colored blue; and regions exhibiting a small but significant difference (20% > ΔD% > 5%) are colored in green, as in Figure 1. The four cluster-coordinating cysteine residues are colored red and labeled. The two leucine residues (L236 and L389) forming van der Walls contacts between two loop structures that display reduced deuterium exchange in the apo enzyme form are shown in stick representation and colored in orange.


