
Fig. 5.
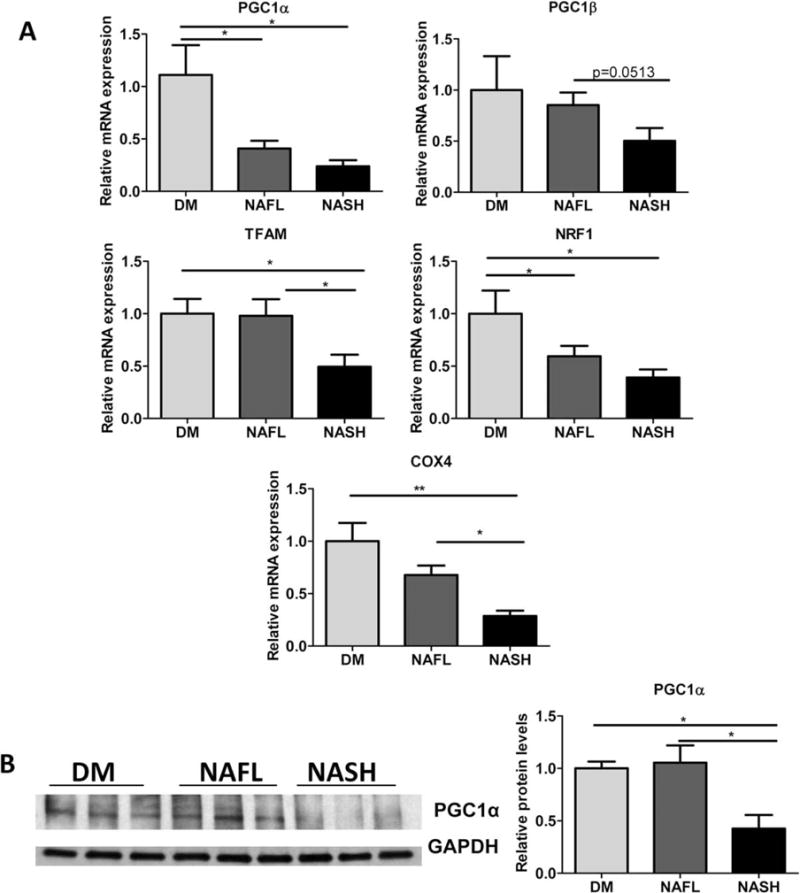
NASH mice experience hepatic mitochondrial dysfunction relative to DM and NAFL mice. (A) Relative mRNA expression levels of Pgc1α, Pgc1β, Tfam, Nrf1 and Cox4 were determined in DM, NAFL, and NASH mice. n = 6–8, *P < 0.05. (B) Protein levels of PGC1α relative to GAPDH protein (as loading control) were assessed in the livers of DM, NAFL, and NASH groups. n ≥ 5, *P < 0.05, **P < 0.01 indicates statistical significance between the relevant groups.