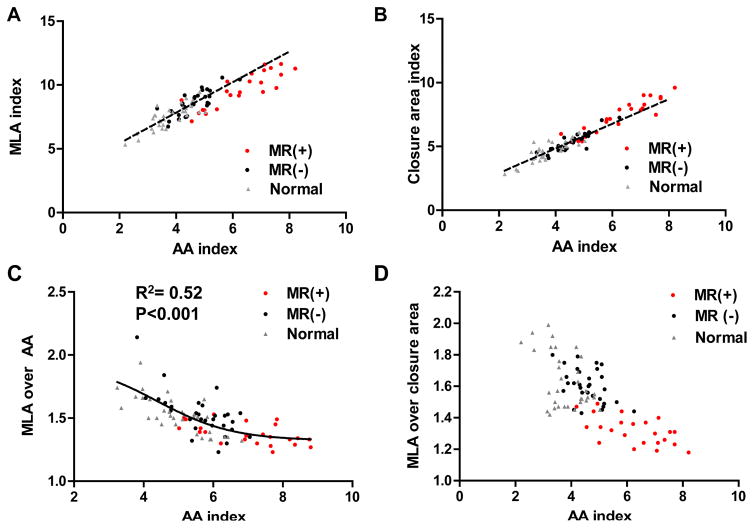
Figure 4. Plateaus in Leaflet Adaptation.
(A): Total MLA increased in parallel with the AA increase, but declined mildly below the regression line at high AA. (B): Closure area likewise increased with AA, but rose mildly above the regression line at high AA. (C, D): Total MLA to AA and total MLA to closure area ratios showed lower plateaus at higher AA.

