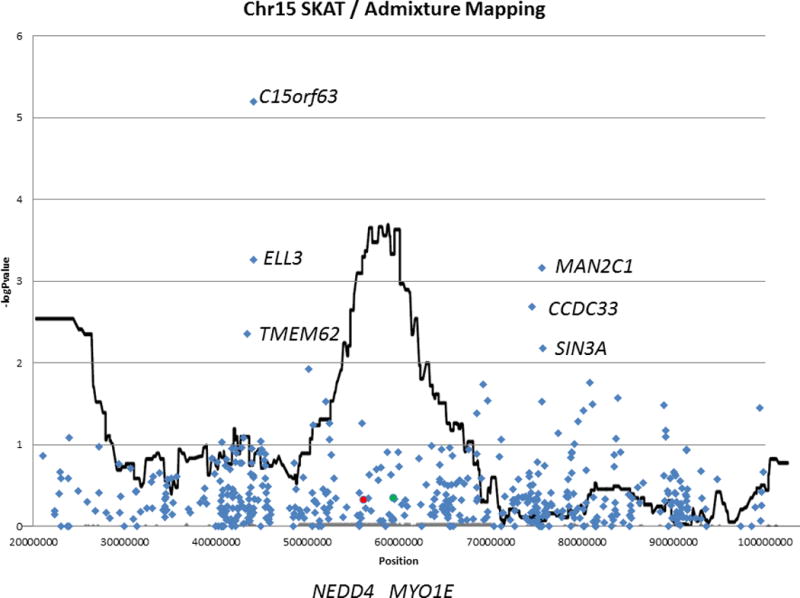
Figure 2. Focused summary of SKAT-O gene-based association results on chromosome 15 overlaid on admixture mapping results.

SKAT-O results for formerly detected genes of interest MYO1E and NEDD4 are indicated by green and red circles, respectively. Suggestive associations in this region flank the admixture mapping signal rather than occurring within the implicated region.
