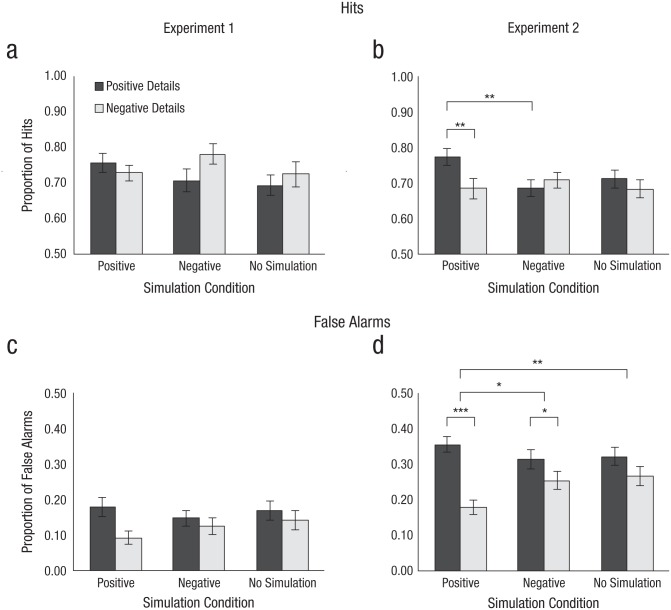
Fig. 1.
Mean hit and false alarm rates for Experiment 1 (collapsed across time delay; a and c) and Experiment 2 (collapsed across past and future simulation; b and d) by simulation valence (positive, negative, no simulation) and valence of detail presented at recognition (positive, negative). Error bars depict standard errors. Asterisks indicate significant differences between conditions (*p < .05, **p < .01, ***p < .001).

