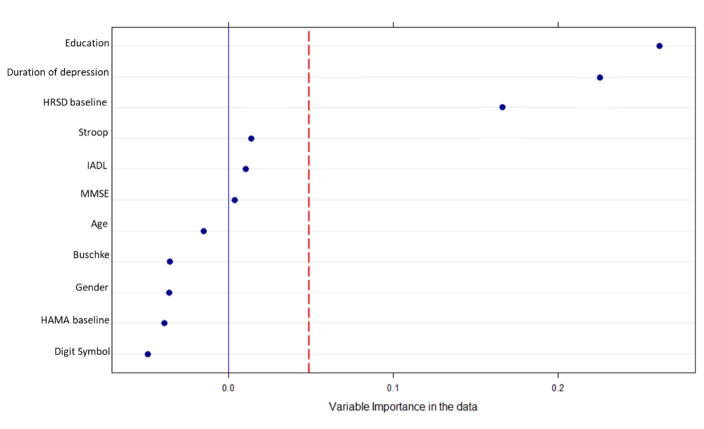
Figure 1.
Variable-importance plot for the model-based recursive partitioning trees. The horizontal axis in Figure 1 represents the average increase in classification accuracy gained by using the specific variable in the “real” data compared to use of the specific variable in permuted (i.e., “mixed up” or fake) data. Positive values indicate that a variable not only predicts patient-specific slope of HRSD outside of a given sample, but that it performs better than random noise. The red line represents the random noise of all potential moderator variables, and is constructed using the absolute value of the worst predictor. Variables to the right of the red line are selected for later modeling.

