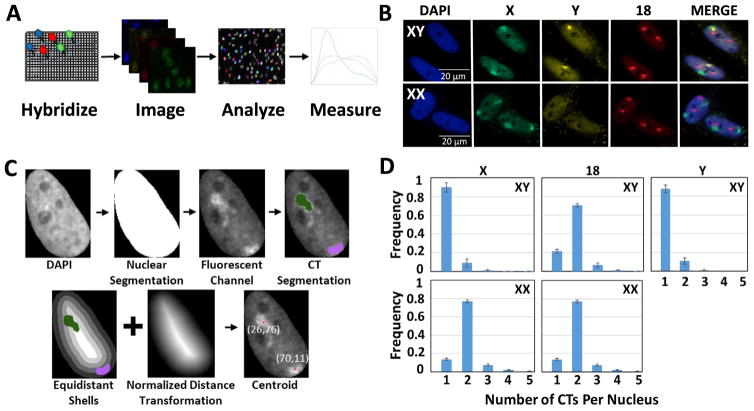
Fig. 1.
HiCTMap imaging, analysis and measurement. (A) HiCTMap pipeline. Cells are cultured in 384-well imaging plates and DNA FISH is carried out using chromosome paints, followed by automated image acquisition using high-throughput microscopy. Image analysis by KNIME segments the nuclei and detects CTs in three channels. CT features are measured and plotted using the R software. (B) CT signal detection. Representative maximal projections of images acquired in three channels. Maximal projections of 40X confocal images z-stacks in 4 channels of XX and XY skin fibroblast stained with DAPI (4′,6-diamidino-2-phenylindole) (Blue-408) and chromosome paint probes (X- Green (Alexa488), 18- Red (Dy505), and Y- FarRed (Dy651)). Scale bar: 20 μm. (C) KNIME automated image segmentation pipeline. Nuclei are segmented using the DAPI channel, thus generating a segmentation mask. The fluorescent channel of each chromosome paint probe is then used to segment CTs of HSA-18, -X, and -Y within the nucleus mask. Positioning of segmented chromosomes using normalized distance transformation and equidistant shells is calculated using the KNIME image analysis pipeline (see Materials and Methods for details). (D) Histogram showing the number of CTs detected per nucleus in XX and XY cells using 2D segmentation. Values represent averages from two biological replicates containing 3 technical replicates ± SD. Histograms represent data from approximately 3800 XY nuclei and XX nuclei each. (For interpretation of the references to colour in this figure legend, the reader is referred to the web version of this article.)

