Fig. 3.
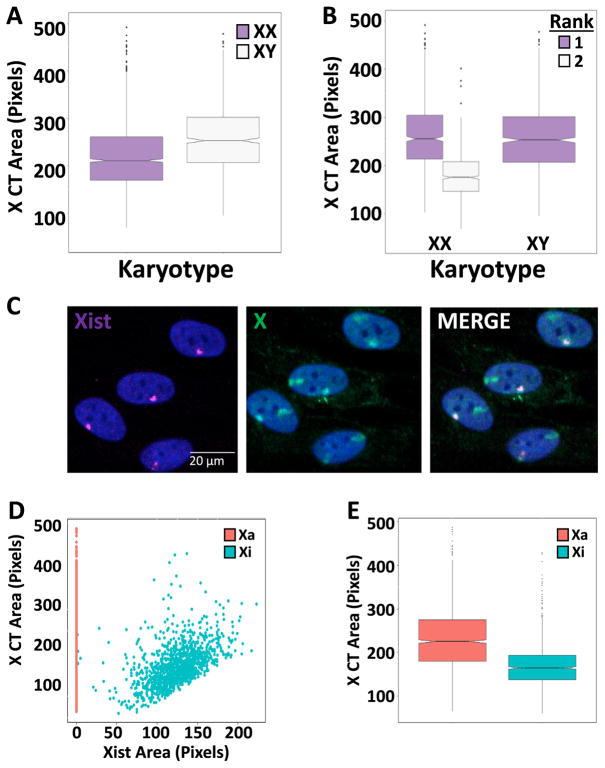
Detection and measurement of Xa and Xi (A) Box plots of X CT area per nucleus in XX and XY cells. (B) Box plots of X CT area of the largest (1) and second (2) largest ranked X CT per nucleus in XX and XY cells. (C) Representative images of combined DNA-RNA FISH (Scale bar: 20 μm). (D) Scatter plot of X CT area in pixels vs. the segmented Xist area normalized to nuclear size (multiplied by 100) in XX cells (Xa = active X chromosome, Xi = inactive X chromosome). Note that all Xa are aligned at 0 due to the lack of Xist staining. (E) Box plots of CT area in Xi vs. Xa per nucleus in XX cells on a per CT basis. Boxes show the 25th, 50th (median) and 75th percentile of the distributions and whiskers extend up to 1.5* inter-quantile range, outliers are shown as dots. Notches indicate the estimated 95% confidence interval of the median (CI). Distributions represent data from approximately 2500 nuclei.

