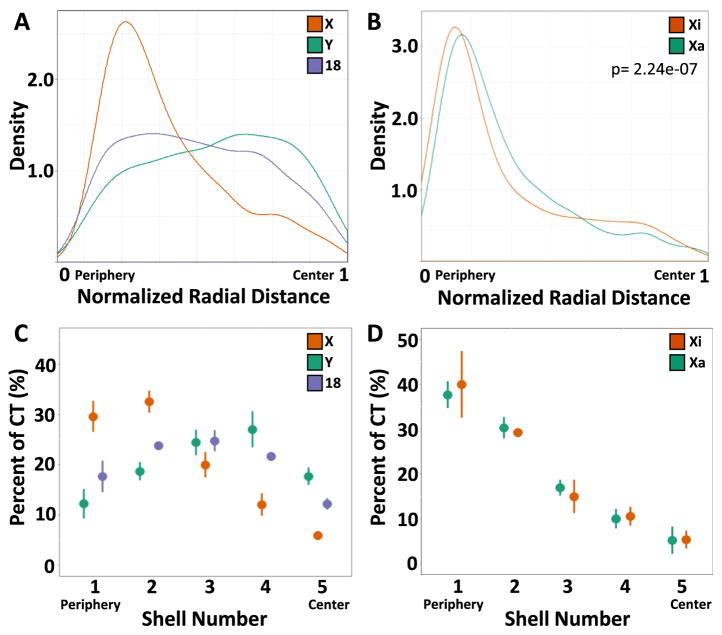
Fig. 4.
Radial positioning of CTs (A) Density curves for normalized radial distance distributions for the indicated chromosome’s centroid. (B) Density curves for normalized radial distance distributions of the centroids of Xa and Xi. (C) The percentage of CTs of HSA-18, -X, and -Y in 5 concentric equidistant nuclear shells. (D) The percentage of Xi and Xa CT in 5 concentric equidistant nuclear shells. Values represent averages from three technical replicates ± SD. Distributions represent data from at least 2500 CTs.

