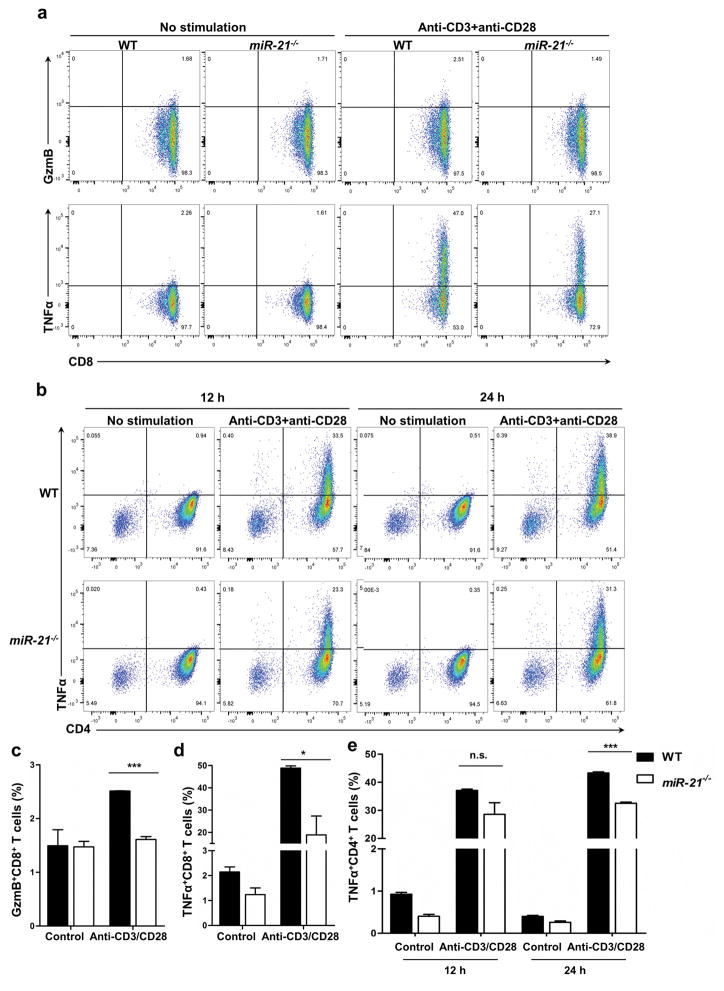
Figure 4. miR-21 in CD8+ T cells and CD4+ T cells.
CD8+ T cells and CD4+ T cells were treated with antibodies against CD3 and CD28 for cytokine and cytolytic granzyme B (GzmB) production. (a and b) Representative graphs of flow cytometry analyses of CD8+ T cells with 24 h treatment (a) and CD4+ T cells with 12 h or 24 h treatment (b) treated with antibodies against CD3 and CD28. (c, d, e) Fractions of GzmB-positive CD8+ T cells (c), TNF-α-positive CD8+ T cells (d), and TNFα-positive CD4+ T cells (e). n = 3 biological isolates for both WT and miR-21−/− groups. *P ≤ 0.05, ***P ≤ 0.001.

